
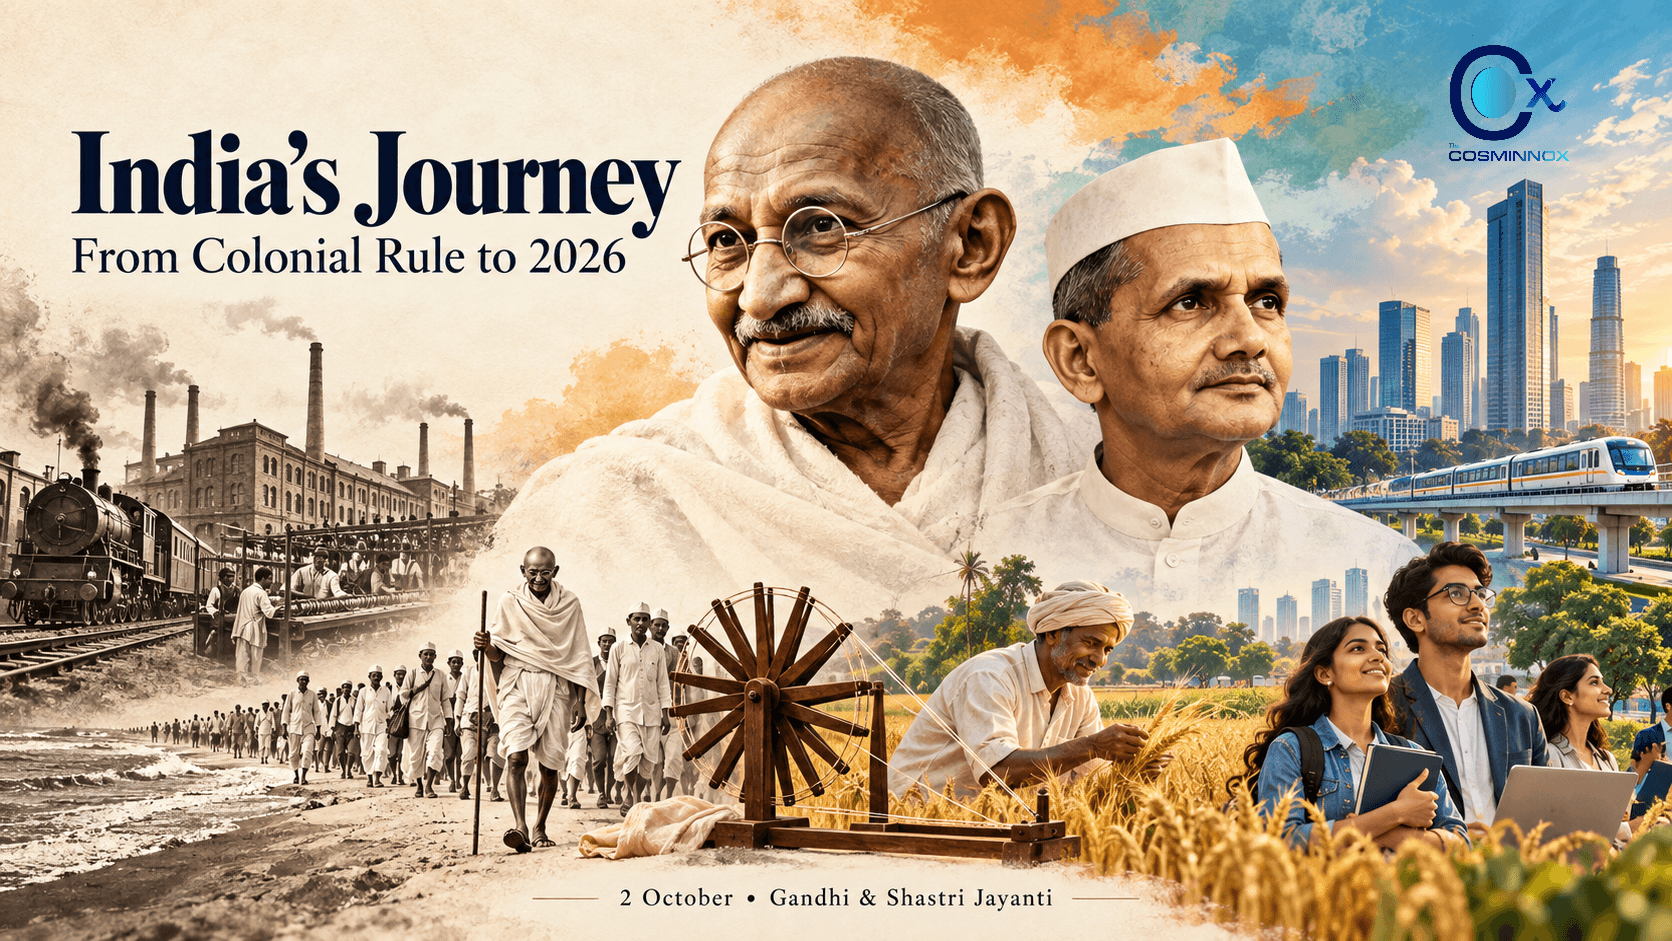
Gandhi Jayanti, observed on Friday, 2 October 2026, marks the 157th birth anniversary of Mahatma Gandhi. The date also commemorates Lal Bahadur Shastri’s birth anniversary, offering an opportunity to reflect on India’s development across different periods of its history.
This case study examines how living conditions changed under British rule, during Gandhi’s lifetime and independence movement, through Shastri’s premiership, and into contemporary India. It explores progress in literacy, life expectancy and food production, alongside continuing challenges in per-capita income, women’s employment and regional poverty disparities.
Observed as a national holiday in India and the UN International Day of Non-Violence, Gandhi Jayanti provides a meaningful setting for this reflection. The figures presented in this study show literacy rising from 5.4% in 1911 to 74.0% in 2011, while extreme poverty declined from 27.1% in 2011–12 to 5.3% in 2022–23. These gains invite a deeper question: how widely has India’s progress improved everyday lives?
Gandhi Jayanti 2026 at a glance
Item | Detail |
Date | Friday, 2 October 2026 |
Anniversary | 157th birth anniversary (Gandhi born 1869, Porbandar) |
Status in India | Gazetted national holiday, one of three national holidays [Tier 3: Awareness Days; Ministry of Home Affairs list to be cited before publication] |
Global observance | UN International Day of Non-Violence since 2007 [UN General Assembly Res. 61/271] |
Shared birthday | Lal Bahadur Shastri, born 2 October 1904 |
India’s Journey Across the Eras
On Gandhi Jayanti, three eras meet. The eras overlap. The Gandhi era (c. 1915-1948) ran inside British rule, so this article treats it as a social and political phase. The British era supplies the economic baseline, and the Shastri premiership (June 1964-January 1966) is the third comparison point.
Flow chart of India from the British era through the Gandhi era, independence and the Shastri era to Gandhi Jayanti 2026
Gandhi Jayanti: Milestones and the Dandi March
Gandhi returned to India in 1915. Over the next 33 years he led or shaped the Champaran campaign (1917), the Non-Cooperation Movement (1920), the Salt March (1930) and the Quit India movement (1942). He began a fast in Delhi on 13 January 1948 to press for an end to communal violence and was assassinated on 30 January 1948 [Tier 2: published historical record; primary archive links to be added].
Timeline of Mahatma Gandhi’s milestones from his 1915 return to India to 1948, relevant to Gandhi Jayanti 2026
The Salt March ran from Sabarmati Ashram to Dandi between 12 March and 6 April 1930, about 240 miles (roughly 385 km) on the historical record. The diagram below shows approximate town positions only. It carries no state or national borders and is not a survey map.
Schematic route map of the 1930 Salt March from Sabarmati to Dandi, a Gandhi Jayanti 2026 explainer
India’s economy and GDP, from the Raj to 2026
British era. Angus Maddison’s estimates put India’s share of world GDP at 24.4% in 1700, 16.0% in 1820, 12.2% in 1870, 7.6% in 1913 and 4.2% in 1950 [Maddison, The World Economy: Historical Statistics, OECD, 2003; Tier 2]. Other economies industrialised faster over the same period, so the series alone does not isolate cause.
Bar chart of India’s share of world GDP falling from 24.4% in 1700 to 4.2% in 1950
Gandhi era. Economic debate centred on Swadeshi and village industry versus large-scale industry. The 1944 Bombay Plan, written by industrialists, argued for state-led heavy industry [Tier 2]. No Tier 1 measurement exists for the aggregate output effect of the khadi and village-industry programme.
Shastri era. The Food Corporation of India and the Agricultural Prices Commission were set up in early 1965, and the National Dairy Development Board in 1965 [Tier 1 institutional records; direct links to be added]. A drought then cut grain output from 89.4 million tonnes in 1964-65 to 72.3 million tonnes in 1965-66, and India imported food [Ministry of Agriculture series; 1964-66 values need a primary-source check].
India in 2026. The Government told Parliament in August 2026 that the IMF’s April 2026 World Economic Outlook records India’s nominal GDP at USD 3.92 trillion for 2025-26, the sixth-largest in the world [Parliament reply reported by Business Standard, 11 Aug 2026; Tier 2]. Some aggregators report a fourth-place rank and about USD 3.96 trillion for the same year. The two accounts differ in vintage and method, and this article does not reconcile them. Per-capita nominal GDP is about USD 2,800 on aggregator reproductions of the IMF series [Tier 3], and India remains lower-middle income by World Bank classification.
Bar chart of India’s foodgrain production from 1950-51 to the 357.7 million tonne final estimate for 2024-25
Foodgrain output reached a record 357.73 million tonnes in 2024-25, the Ministry of Agriculture’s final estimate released on 21 November 2025 [reported by Global Agriculture; Tier 2].
Social change: literacy, life expectancy and poverty
Literacy is the longest consistent social series available. It rose from 5.4% in 1911 to 16.1% in 1941, 28.3% in 1961 and 74.0% in 2011, the latest completed census [Census of India; 1921 and 1931 values need a primary-source check].
Bar chart of India’s literacy rate from 5.4% in 1911 to 74.0% in the 2011 census
Poverty lines changed definition between periods, so no pre-1950 poverty rate is shown. For the recent period, the World Bank reports that extreme poverty fell from 27.1% in 2011-12 to 5.3% in 2022-23 at the USD 3.00-a-day line. At the USD 4.20 line, poverty fell from 57.7% to 23.9% [World Bank Poverty and Equity Brief, April 2025, as reported by Business Today].
Grouped bar chart of India’s poverty rates falling between 2011-12 and 2022-23 on two World Bank poverty lines
Indicator | British era (to 1947) | Gandhi era | Shastri era | 2026 position |
Literacy | 5.4% (1911) | 7.2% (1921) to 16.1% (1941) | 28.3% (1961) | 74.0% (2011 census) |
Life expectancy | About 32 years (c. 1941-50) | Same range | Mid-40s (approximate; source to be fixed) | 70.2 years (2022, World Bank) |
Famine and food | Bengal 1943: 1.5 to 3 million deaths estimated, causes disputed | 1943 falls inside this era | 1965-66 drought, grain imports | Record 357.73 Mt output; extreme poverty 5.3% (2022-23) |
Territory and state | British provinces plus about 560 princely states | Partition 1947; displacement estimated at 10-20 million, deaths disputed | Sovereign republic; 1965 war; Tashkent Declaration, January 1966 | Sovereign state; population about 1.48 billion |
Income distribution | No reliable national series | No reliable national series | Not comparable | Consumption Gini 25.5 (2022-23), from 28.8 (2011-12) |
Bar showing roughly 60% British-ruled provinces and 40% princely states in pre-1947 territory
Gandhi Jayanti: His Vision and India’s Progress
Three Gandhian programmes can be compared with recorded outcomes, with limits on what the data prove.
Village industry and khadi. The 1944 Bombay Plan favoured state-led heavy industry instead. Post-1947 planning leaned toward heavy industry, and aggregate data cannot show what a Gandhian alternative would have produced.
Education. Gandhi’s Nai Talim conference at Wardha took place in 1937, when national literacy was in the mid-teens. Literacy reached 74.0% by 2011, though the census series cannot attribute that rise to any single programme.
Untouchability. Gandhi founded the Harijan Sevak Sangh in 1932, the year of the Poona Pact on 24 September. The Constitution abolished untouchability under Article 17 in 1950. Gandhi and B. R. Ambedkar held different positions on electorates and on the Poona Pact, and both views are documented in the historical record.
Observations on India’s Development Journey
The indicators presented suggest substantial progress in education, health, poverty reduction and agricultural production. Literacy increased from approximately 18.3% in 1951 to 74% in 2011, while life expectancy rose from around 32 years in the 1940s to approximately 70 years in 2022. The cited poverty estimates also indicate declining deprivation, and foodgrain production has expanded considerably since the drought-affected year of 1965–66. These comparisons describe long-term changes, although their reference periods and measurement methods differ.
Historical events also help explain the conditions within which development took place. The Bengal famine of 1943 and displacement during Partition caused widespread hardship. The agricultural decline of 1965–66 and reliance on food imports subsequently highlighted the importance of strengthening food security.
Recent figures suggest areas where further progress could broaden these gains. The cited female employment rate of 31% in 2022–23 points to scope for expanding women’s access to paid work. The concentration of 54% of India’s extreme poor in five states indicates the relevance of locally tailored development efforts. Per-capita income below the World Bank’s upper-middle-income threshold similarly suggests room for continued improvements in productivity, earnings and economic opportunity.
Together, these observations show expanding national capacity alongside opportunities to make its benefits more widely accessible.
Reading India’s Past Beyond the Numbers
India’s economic journey carries both measurable achievements and historical debates. GDP estimates, literacy rates and poverty figures help describe changes in people’s lives, but they cannot fully explain the decisions, institutions and inequalities that shaped those changes.
The colonial “drain of wealth” remains one such debate. Economist Utsa Patnaik has argued that colonial arrangements transferred an enormous amount of value from India to Britain. The size of that transfer depends on assumptions about trade, the alternative uses of those resources and the accumulation of interest over time. Consequently, a historical GDP-share chart should be read as an estimate of India’s relative economic output, rather than as a measurement of colonial extraction.
The Bengal famine of 1943 similarly requires more than a single explanation. Amartya Sen’s entitlement approach emphasises how people can starve when they lose the purchasing power or access needed to obtain food. Other scholarship examines wartime inflation, administrative decisions, procurement and transport restrictions. These explanations can overlap: the availability of food, its affordability and the government’s response all shaped the crisis.
Contemporary GDP rankings require a different kind of care. Conflicting claims about India’s position can arise from different publication dates, forecasts, exchange rates and accounting periods. Nominal GDP and purchasing-power-parity GDP also produce different rankings. Any precise claim about India’s place in 2026 should therefore identify the IMF database edition, measurement and year used.
India’s Progress and the Promise of 2 October
The distance between colonial India and contemporary India is visible in wider educational access, longer lives, stronger agricultural capacity and declining monetary poverty. These achievements reflect decades of public investment, scientific advances, enterprise and social change.
Yet national progress has reached communities unevenly. Greater economic output does not automatically provide a secure income, a good school or affordable healthcare. Historical comparisons are most meaningful when they connect national indicators with the circumstances of ordinary households.
Gandhi’s emphasis on dignity and local livelihoods, alongside Shastri’s concern for farmers and national resilience, offers a useful perspective on this unfinished work. Their legacies invite India to consider how prosperity is created, who benefits from it and whether development strengthens the lives of those with the fewest opportunities.
A Shared Birthday with Lasting Significance
Friday, 2 October 2026, marks Gandhi’s 157th birth anniversary and Lal Bahadur Shastri’s 122nd birth anniversary. The occasion brings together two distinct contributions to India’s history: Gandhi’s leadership of the freedom movement and Shastri’s leadership during a period of war and food insecurity.
Gandhi Jayanti is observed as a national holiday in India. Commemorations include tributes, educational programmes and reflections on Gandhi’s ideas. Holiday arrangements should be checked against the relevant institutional calendar rather than assuming that every workplace closes.
The date also carries international significance. In 2007, the United Nations General Assembly established 2 October as the International Day of Non-Violence, recognising Gandhi’s enduring association with peaceful resistance. The observance encourages education and public awareness about non-violence.
Shastri, born in 1904, served as Prime Minister from June 1964 until January 1966. His brief premiership encompassed the 1965 war with Pakistan and severe agricultural pressures. His emphasis on soldiers and farmers connected national security with the everyday work of feeding the country.
Education as a Measure of Social Change
The expansion of literacy is among the clearest signs of India’s transformation. Historical Census benchmarks show literacy rising from 18.33% in 1951 to 28.30% in 1961. More recently, PLFS 2025 reported an overall rate of 81.1%. These figures demonstrate substantial progress, although Census and survey methods—and historical age coverage—differ. They should not be presented as a perfectly uniform statistical series.
Education has opened opportunities for participation, employment and greater independence. However, national averages conceal persistent differences between rural and urban communities and between women and men. The next stage of educational progress therefore depends on both wider access and the quality of learning.
Poverty Reduction and the Search for Economic Security
Poverty estimates show another important change. The World Bank’s 2025 assessment placed India’s extreme-poverty rate at approximately 5.3% in 2022–23, using the US$3-a-day threshold in 2021 purchasing-power terms. This represented roughly 75 million people—a substantial population despite the decline in deprivation.
A poverty threshold captures a particular level of monetary deprivation. Crossing it does not necessarily mean a household can withstand illness, unemployment or an unexpected expense. Estimates can also change when surveys, purchasing-power calculations and poverty lines are updated.
On Gandhi Jayanti, these figures give the historical comparison a human purpose. India’s achievements deserve recognition, while its remaining inequalities demand attention. The relevance of Gandhi and Shastri lies in the continuing effort to make national progress meaningful in people’s daily lives.
Add the following Sources and Endnotes section after the article. Place the corresponding bracketed numbers after the relevant sentences in the main text.
Sources and Endnotes
[1] Colonial transfers and the drain of wealth
Patnaik, Utsa. “Revisiting the ‘Drain’, or Transfers from India to Britain in the Context of Global Diffusion of Capitalism.” In Agrarian and Other Histories: Essays for Binay Bhushan Chaudhuri, edited by Shubhra Chakrabarti and Utsa Patnaik, 2018, pp. 277–317.
This is the chapter underlying Patnaik’s argument. Its estimate should be attributed to her methodology rather than presented as an agreed measurement of colonial extraction. Publisher’s book page. Cambridge Core
[2] Historical GDP estimates
Bolt, Jutta, and Jan Luiten van Zanden. Maddison Project Database 2023. Groningen Growth and Development Centre, University of Groningen.
Historical GDP figures are reconstructed estimates. Identify the database edition used in any chart, and distinguish GDP levels, GDP per capita and shares of world output. The database does not directly measure the colonial drain. Database and documentation. University of Groningen
[3] Sen’s explanation of famine
Sen, Amartya. Poverty and Famines: An Essay on Entitlement and Deprivation. Clarendon Press, 1981.
Sen examines how people lose access to food through changes in earnings, prices and entitlements. His analysis includes the Bengal famine of 1943. Author’s publication record. Amartya Sen
[4] Wartime conditions and the Bengal famine
Mukherjee, Janam. Hungry Bengal: War, Famine and the End of Empire. Oxford University Press, 2015.
This study examines wartime mobilisation, rising prices, colonial administration and the famine’s social consequences. It complements the discussion of food access with a detailed historical account of wartime priorities. Publisher’s page. Oxford Academic
[5] India’s economic position
International Monetary Fund. World Economic Outlook Database, April 2026.
For an economic ranking, specify the database edition, year and indicator. Nominal GDP in current US dollars and GDP measured at purchasing-power parity produce different comparisons. This reference alone does not substantiate either fourth or sixth place; the relevant country values must be extracted and compared. IMF database. imf.org
[6] Lal Bahadur Shastri’s life and leadership
Prime Minister’s Office, Government of India. “Shri Lal Bahadur Shastri.”
The official biography records his birth on 2 October 1904, premiership from 9 June 1964 to 11 January 1966, and earlier resignation as railway minister following a fatal accident. Official biography. www.pmindia.gov.in
[7] International Day of Non-Violence
United Nations General Assembly. Resolution A/RES/61/271, 2007.
The resolution established 2 October as the International Day of Non-Violence, promoting its message through education and public awareness. United Nations observance page. www.un.org
[8] Historical literacy benchmarks
Press Information Bureau, Government of India. “Literacy Scenario in India.”
The historical table records literacy of 18.33% in 1951 and 28.30% in 1961. Historical Census figures should not all be described as covering people aged seven and above: the 1961 Census used an age-five threshold. Historical literacy table. www.pib.gov.in
[9] Recent literacy and educational disparities
Press Information Bureau, Government of India. “Literacy for All.” 29 September 2026, citing PLFS 2025.
The publication reports overall literacy of 81.1%, with urban–rural and gender differences. Retain the survey year when quoting these figures. Official factsheet. www.pib.gov.in
[10] Extreme poverty in 2022–23
World Bank. India Poverty and Equity Brief, 2025.
The brief reports an extreme-poverty rate of approximately 5.3% in 2022–23 under the US$3-a-day threshold in 2021 purchasing-power terms. The reference year and poverty-line definition should accompany the figure. World Bank brief. documents1.worldbank.org
[11] Understanding revisions to poverty estimates
World Bank. “June 2025 Update to Global Poverty Lines.” 5 June 2025.
Changes in purchasing-power calculations, poverty thresholds and survey data can revise estimates. Comparisons should use a consistent poverty line and data release. Methodological explanation. www.worldbank.org
Editorial note: The paragraphs drawing lessons from Gandhi and Shastri are the article’s interpretation. They should remain distinct from measured statistical findings.