
Key Voices: Raghuram Rajan · Subhash Chandra Garg · Piyush Goyal · Arvind Panagariya · MoSPI (Official)
Subject: Macroeconomy & Employment | Data Source: MoSPI / NSO / PLFS / CMIE | Period Covered: Q1 FY26 – Q1 FY27
SEPTEMBER 2026
01 EXECUTIVE SUMMARY
India's real GDP grew 7.8% year-on-year in the April–June quarter of FY 2026-27, MoSPI announced on August 31, 2026 — the fifth consecutive quarter of strong growth, and comfortably ahead of the RBI's own 7% forecast. Within days, former RBI Governor Raghuram Rajan and former Finance Secretary Subhash Chandra Garg publicly questioned whether the number reflects reality, pointing to weak job creation and soft private investment; the government, MoSPI, and economists including Arvind Panagariya pushed back hard. This case study documents the headline number, the employment data it sits alongside, the specific claims on both sides, and a near-identical episode from 2019 that the current debate echoes — closing with a bounded assessment of what the public record actually establishes.
Metric | Figure | Period |
Real GDP growth | 7.8% | Q1 FY27 (Apr–Jun 2026) |
PLFS unemployment (CWS) | 5.1% | July 2026 |
Youth (15–29) unemployment | 9.9% | 2025 (down from 10.9% in 2022) |
CMIE unemployment estimate | Typically 7–8%, vs. NSO's ~3% | Persistent methodological gap |
02 THE HEADLINE NUMBER
Real GDP grew 7.8% year-on-year in Q1 FY27, per MoSPI/NSO. Nominal GDP came in at ₹88.27 lakh crore (up 10.3%), against ₹80 lakh crore a year earlier. Real Gross Value Added (GVA) — GDP minus net taxes — grew 8.2% to ₹73.82 lakh crore. This continues a five-quarter run of strong growth: Q1 FY26 (6.9%), Q2 FY26 (8.2%), Q3 FY26 (revised to 8.0%), Q4 FY26 (8.6%, full-year FY26 at 7.8%, up from 7.2% in FY25), and Q1 FY27 (7.8%).
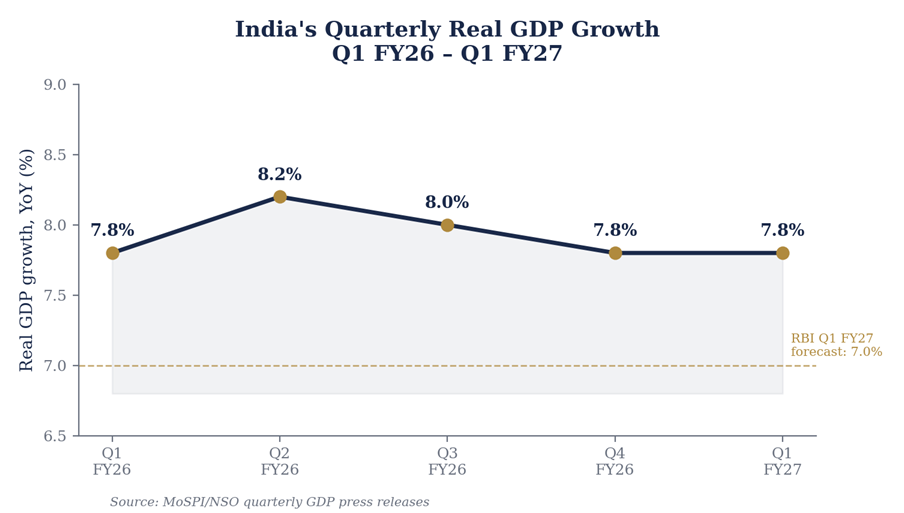
Fig. 1 — Real GDP growth by quarter. Source: MoSPI/NSO quarterly GDP press releases.
Quarter | Real GDP growth (YoY) | Note |
Q1 FY26 | 7.8% | Five-quarter high at the time |
Q2 FY26 | 8.2% | Six-quarter high; secondary + tertiary sector led |
Q3 FY26 | 8.0% | Revised upward from initial 7.8% estimate |
Q4 FY26 | 7.8% | Closed FY26 at 7.7% full-year growth |
Q1 FY27 | 7.8% | Beat RBI's 7% forecast for the quarter |
A base-year complication
MoSPI shifted the GDP series to a new 2022-23 base year in February 2026, from 2011-12. Under the revised series, the Q1 FY26 estimate originally released at ₹86.05 lakh crore (old series) was restated to ₹80.32 lakh crore, then ₹80.44 lakh crore, then ₹80 lakh crore as updated IIP and PPI data came in. MoSPI has stated explicitly that the old- and new-series figures are not directly comparable — a distinction some critics in the current debate have been accused of blurring.
03 WHERE THE GROWTH CAME FROM
Services led Q1 FY27 growth at 10.0%, the single largest contributor to the headline figure. Manufacturing's real GVA grew 9.2%, even as nominal GVA grew only 7.7% — a gap MoSPI attributed to a negative implicit GVA deflator of -1.5%, driven by input costs (textiles, basic metals, rubber and plastics) rising faster than output prices, a pattern the ministry said matches OECD research on deflator volatility during global commodity shocks. Agriculture grew 3.6%; mining contracted 2.4%.
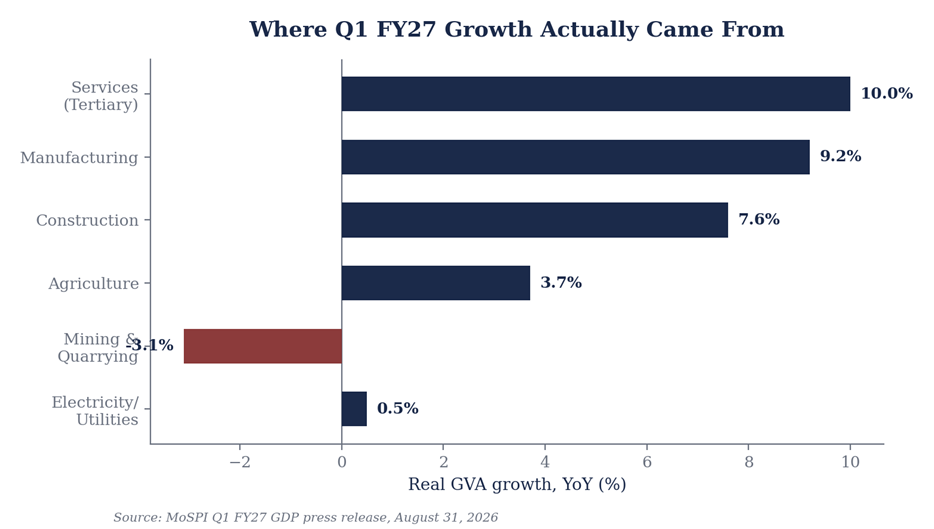
Fig. 2 — Sector-wise real GVA growth, Q1 FY27. Source: MoSPI, August 31, 2026.
04 THE EMPLOYMENT GAP
Officially, employment looks stable. PLFS put Current Weekly Status unemployment at 5.1% in July 2026, against 5.5% in May and 5.2% in April — broadly flat, and below the 8.04% historical average MoSPI has recorded since 2018. Annual Usual Status unemployment was 3.1% in 2025, down from 3.3% in 2024. Youth (15–29) unemployment fell to 9.9% in 2025 from 10.9% in 2022, with the youth Worker Population Ratio rising to 41.4% from 38.5%, per figures the Labour Minister presented in the Lok Sabha.
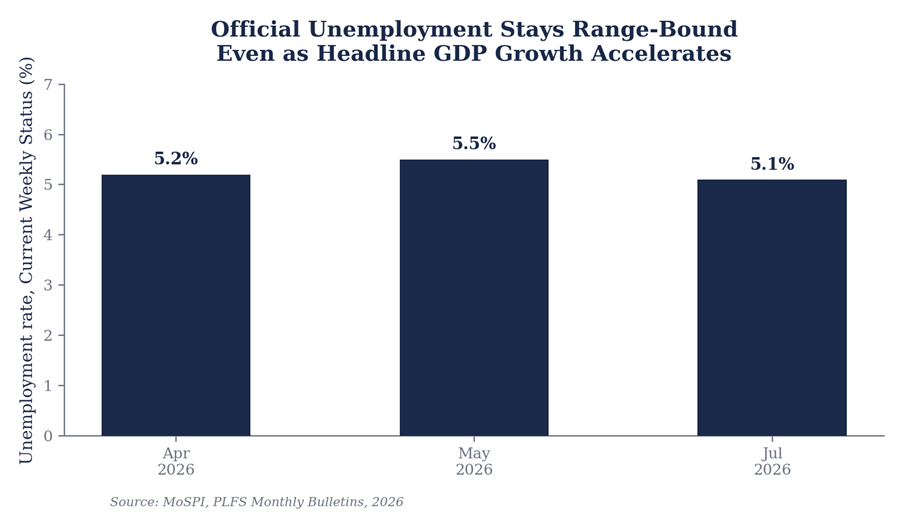
Fig. 3 — PLFS unemployment rate (Current Weekly Status), 2026 monthly bulletins.
Two complications sit underneath this stability. First, labour force participation itself softened through 2026 — the overall LFPR fell to 54.4% in June from 55% in April — meaning part of the steady unemployment rate reflects fewer people actively seeking work. Second, CMIE's Consumer Pyramids survey has for years reported unemployment running several points above PLFS, a persistent, unresolved methodological gap rather than a one-off discrepancy.
Why PLFS and CMIE disagree
Source | Method | Typical reading |
PLFS (MoSPI/NSO) | Large stratified household sample; counts an hour of any paid work in the reference period as employment, including casual and unpaid-family work | ~3–5% (usual status) |
CMIE (Consumer Pyramids) | Private panel survey, stricter employment definition, different recall structure | ~7–8% |
The more consequential — and less disputed — finding is compositional: services and finance, which led Q1 FY27 growth, are historically less labour-intensive per rupee of output than manufacturing or construction. This "job-poor growth" pattern is well documented independent of this quarter's numbers and is a separate question from whether the GDP figure itself is accurate.
05 WHAT THE ECONOMISTS ARE SAYING
Former RBI Governor Raghuram Rajan, in a PTI interview published September 2, 2026, said he had doubts about the growth figures and asked why the economy was not generating more good jobs or drawing more private investment if it were truly growing this fast.
“If the economy is really doing so well, why are we still unable to create enough good jobs? And why is investment not taking place?” — Raghuram Rajan, former RBI Governor, September 2, 2026 |
Subhash Chandra Garg, a former Finance Secretary and former Secretary of the Department of Economic Affairs under the Modi government, went further, stating on X that Q1 FY27 growth in current (nominal) prices was actually 2.6%, and that real growth was "close to zero" once distortions in manufacturing and consumption were accounted for — a specific, quantified counter-estimate.
MoSPI issued a detailed methodological clarification on September 2, 2026, addressing the manufacturing deflator anomaly directly. Union Commerce Minister Piyush Goyal dismissed the criticism, calling Rajan and Garg "jobless people" attempting to mislead the public and stating the government does not fabricate GDP data. Former NITI Aayog CEO Amitabh Kant argued the criticism conflated the old and new GDP series. Economist Arvind Panagariya argued that manipulating GDP at scale is technically implausible given the number of independent data feeds — tax collections, IIP, corporate results, trade data — that would all have to move in coordinated lockstep.
Positions, side by side
Voice | Position | Core claim |
Raghuram Rajan (former RBI Governor) | Skeptic | Growth-jobs-investment disconnect; questions whether the headline number is “real” |
Subhash Chandra Garg (former Finance Secretary) | Skeptic | Estimates real growth near 0%; nominal growth at 2.6%, not 10.3% |
Piyush Goyal (Union Commerce Minister) | Defender | Government does not fabricate data; critics are politically motivated |
Amitabh Kant (former NITI Aayog CEO) | Defender | Critics are comparing incompatible old- and new-series GDP figures |
Arvind Panagariya (economist) | Defender | Manipulating GDP at scale is implausible given multiple independent data feeds |
MoSPI (official) | Data source | Manufacturing deflator anomaly is a known, OECD-documented statistical effect |
06 THE 2019 PRECEDENT
This is not the first formal, credentialed challenge to India's GDP methodology. In June 2019, Arvind Subramanian — himself a former Chief Economic Adviser — published a Harvard CID working paper, “India's GDP Mis-estimation: Likelihood, Magnitudes, Mechanisms, and Implications.” Analysing 17 real-economy indicators, he argued growth between 2011-12 and 2016-17 had been overstated by roughly 2.5 percentage points a year — actual growth closer to 4.5%, not the official 6.9%, with a 95% confidence band of 3.5% to 5.5%. He attributed the gap to methodological changes from the 2011-12 base revision, not deliberate manipulation.
The Economic Advisory Council to the PM (EAC-PM) issued a formal rebuttal within days, arguing Subramanian had “cherry-picked” indicators and that his methodology was not statistically robust. The 2019-20 Economic Survey later devoted a full chapter to the question, concluding, using new firm- and district-level data, that there was “no evidence of mis-estimation.” Subramanian stood by his estimate and published a follow-up defence.
That episode is the clearest precedent for the current one: a credentialed former government economist making a specific, numbers-based challenge, met by an equally specific institutional rebuttal, with no resolution satisfying both sides. What's different in 2026 is that no critic — including Rajan or Garg — has yet published a full alternative GDP model with Subramanian's 2019 level of indicator-by-indicator detail; Garg's “close to zero” figure has been stated publicly but not yet backed by a published working paper.
07 COUNTER-EVIDENCE
Several independent, high-frequency indicators moved in the same direction as the GDP print during the period — the kind of cross-checking economists typically use to sanity-test a national accounts estimate.
Indicator | Reported movement | What it corroborates |
GST collections | Sustained growth through 2026, independently audited | Formal-sector activity |
Central government capex | Up 30.7% (Q2 FY26, per CEA presentation) | Investment-linked growth |
Bank credit growth | 10.8% (Q2 FY26) | Credit-financed activity |
Retail inflation (CPI) | Fell to 0.25% in Oct 2025, partly on GST rationalisation | Supply-demand balance |
Steel, commercial vehicle, household vehicle sales | Healthy growth through FY26, per MoSPI's FY26 estimates release | Industrial and consumption demand |
None of this proves the 7.8% figure is precisely correct — corroboration in direction is not validation of magnitude — but it weighs against the strongest form of the “fabrication” claim, which would require these largely independent data streams to have moved in coordinated lockstep.
08 WHAT THE EVIDENCE ESTABLISHES
Question | What the record supports |
Is 7.8% MoSPI's genuine official estimate? | Yes — methodologically consistent with the prior four quarters, and directionally corroborated by GST, capex, credit and consumption data. |
Is the methodology genuinely contested? | Yes — two material base/series changes since 2011-12 have created documented comparability problems, flagged on the record by a former RBI Governor and a former Finance Secretary, echoing a former CEA in 2019. This is a live, unresolved methodological debate. |
Has employment collapsed? | No — PLFS shows broadly stable unemployment and rising youth Worker Population Ratios through 2026, even as labour force participation has softened and CMIE's estimate remains structurally higher, a gap that predates this quarter's debate. |
Is the data being deliberately manipulated? | Unproven — this is an allegation made by named critics, not a finding substantiated by any independent audit, forensic review, or published alternative model as of this writing. |
09 SUMMARY
India's 7.8% Q1 FY27 GDP print stands as MoSPI's official, methodologically consistent estimate, corroborated in direction by independent high-frequency data. It sits beside a genuinely stable — not collapsing — official employment picture, and a genuinely unresolved question about whether India's changing GDP methodology captures the economy's true pace, a question credentialed economists have now raised twice in seven years without a conclusive resolution either time. The claim that the data is being deliberately manipulated remains a contested allegation rather than an established fact, and this case study has treated it as such throughout.
Sources: MoSPI/NSO GDP and PLFS press releases, CMIE data, EAC-PM publications, and on-record statements by Raghuram Rajan, Subhash Chandra Garg, Piyush Goyal, Amitabh Kant, Arvind Panagariya and Arvind Subramanian, reported by PTI, Business Today, Business Standard, The Print, Deccan Herald, Swarajya, Outlook Business and Tribune India (June 2019 – September 2026).