
This piece asks one question: why can urban household spending fall while consumer prices rise, and does faster rural spending signal greater prosperity? The evidence available on 6 October 2026 points to household budget pressure in India built from three overlapping channels. Prices rise faster than some incomes. Loan repayments claim income before everyday purchases. Some spending is financed by borrowing rather than earnings. The data are consistent with all three. They do not isolate any one of them.
Short answer: Urban spending can fall while prices rise because inflation shrinks what each rupee buys, and EMIs take a fixed share of income first. Worldpanel’s Kharcha survey found urban FMCG spending down 4% year on year in Q1 FY27, while MoSPI recorded 4.82% retail inflation in August 2026.
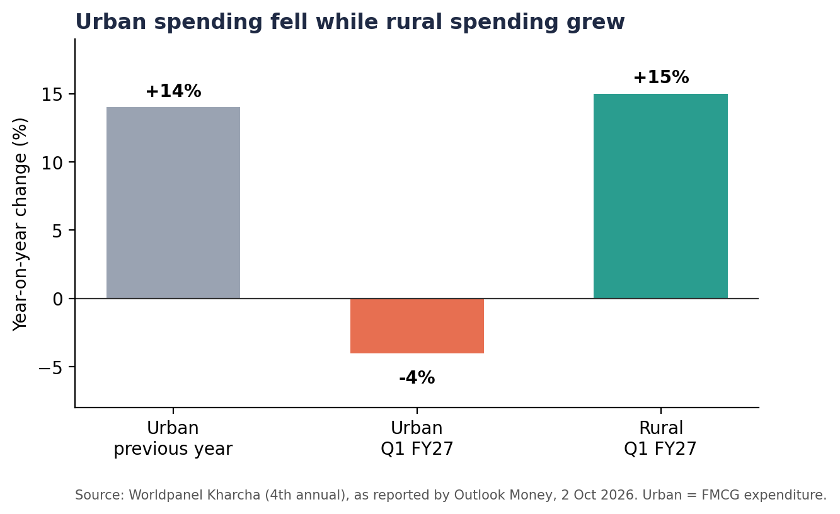
Figure 1: Urban versus rural household spending change, Q1 FY27 (Worldpanel Kharcha).
What the 2026 data say about household budget pressure
The spending evidence comes from Worldpanel’s fourth annual Kharcha report, based on around 6,000 urban and rural households surveyed in April 2026, as reported by Outlook Money. Prices come from MoSPI’s August 2026 CPI release. Household borrowing comes from the RBI’s June 2026 Financial Stability Report (FSR).
Indicator | Figure | Source and period |
Urban household FMCG spending, year on year | −4% (previous year: +14%) | Worldpanel Kharcha, Q1 FY27 |
Rural household spending, year on year | +15%, to Rs 53,760 per quarter | Worldpanel Kharcha, Q1 FY27 |
Affluent / less affluent urban households, quarterly spend | Rs 81,759 / Rs 49,832 (each −4%) | Worldpanel Kharcha, Q1 FY27 |
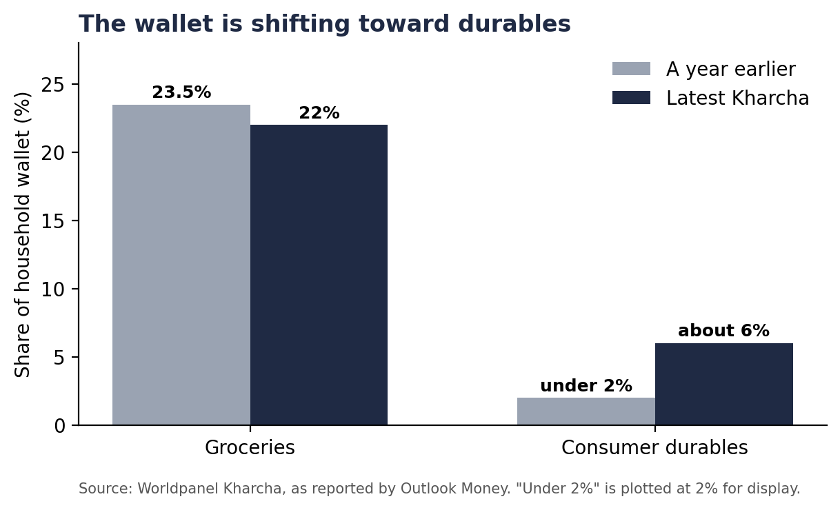
Share of household wallet: groceries / consumer durables | 22% (23.5% a year earlier) / about 6% (under 2% previously) | Worldpanel Kharcha |
Shoppers buying only essentials / sticking to a budget | 86% / 74% (69% a year earlier) | Worldpanel Kharcha |
Households feeling budget pressure | 84% | CNBC-TV18 headline on the report |
Retail inflation (CPI, base 2024), August 2026 | 4.82% (provisional) | MoSPI |
Household debt, end-September 2025 | 45.5% of GDP | RBI FSR, June 2026 |
Figures are as of the dates shown. August 2026 CPI is provisional. The 84% figure comes from CNBC-TV18’s coverageof the report; the survey question behind it should be checked in Worldpanel’s report.
Why urban spending can fall while prices rise
Falling spending during a period of rising prices is not a contradiction. It is what a budget constraint produces when several things coincide.
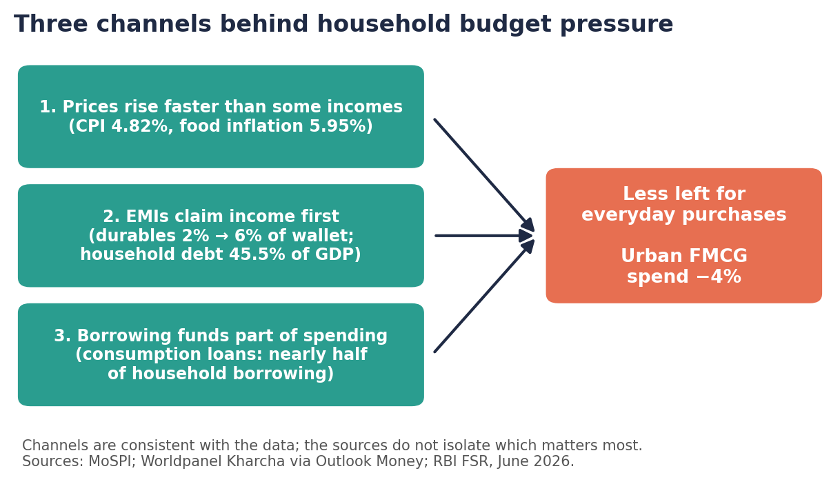
Figure 2: Three channels consistent with the data. The sources do not isolate which matters most.
Income growth lags price growth. The RBI Annual Report 2024–25, as summarised by Sanskriti IAS, describes real income growth as uneven outside formal, high-productivity sectors. Earlier Citi data, reported by Reuters, put inflation-adjusted wage cost growth at listed firms below 2% in each of the first three quarters of 2024, against a 10-year average of 4.4%. Citi used it as a proxy for urban earnings. It is 2024 data, not a 2026 measurement.
Households prioritise and trade down. In the Kharcha data, 86% of consumers bought only essentials. In January 2025, Business Standard reported that Hindustan Unilever and Parle Products had flagged weak urban demand and a shift to smaller packs. Those are company statements. Hindustan Unilever described the shift as temporary.
Fixed obligations come first. The EMI section below covers this.
One caution applies. Kharcha figures are in rupees. If the prices of goods in a household’s basket rose at all, a 4% fall in rupee spending implies a larger fall in quantity bought, or a move to cheaper products. The sources do not separate volume, price and mix.
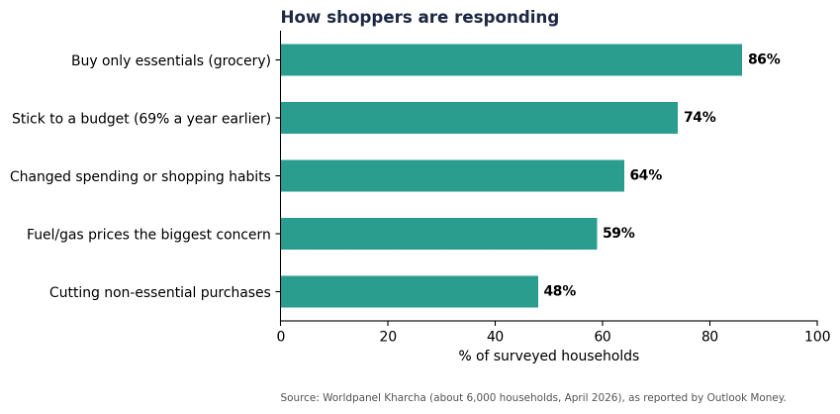
Figure 3: How shoppers are responding (Worldpanel Kharcha, April 2026).
How inflation reduces purchasing power
Purchasing power is what a unit of income buys. When prices rise faster than income, the same income buys less. In real terms, the change is roughly income growth minus inflation.
MoSPI puts August 2026 retail inflation at 4.82% and food inflation at 5.95%. Deccan Chronicle, citing MoSPI, reports that inflation has risen each month since May: 3.93%, 4.38% in June, 4.45% in July and 4.82%. DT Next reports that the RBI projects about 5% for 2026–27. The FSR also flags a projected weak monsoon linked to El Niño as a risk that could push inflation toward the upper end of the tolerance band in Q3. All current readings sit inside the RBI’s 2–6% range, so budget pressure can coexist with inflation the central bank considers acceptable.
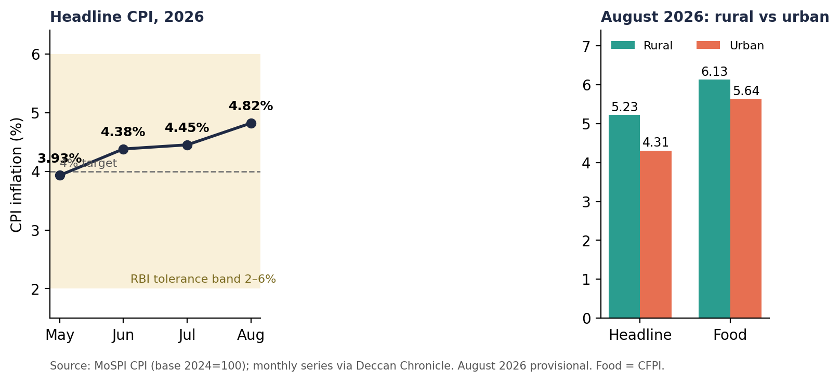
Figure 4: Headline CPI inside the RBI band, and rural versus urban inflation, 2026 (MoSPI).
Illustrative arithmetic, not survey data: if income rises 3% while prices rise 4.82%, purchasing power falls about 1.7% (1.03 ÷ 1.0482 − 1). Food inflation of 5.95% bites harder where food takes a larger share of the budget. Groceries are 22% of the Kharcha wallet.
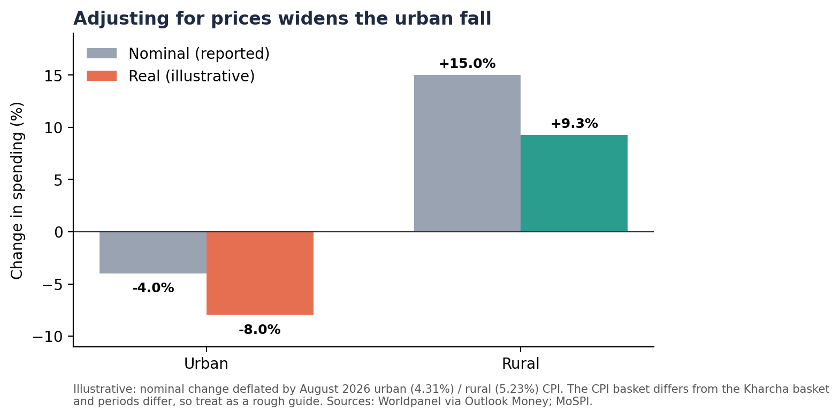
Figure 5: Nominal versus illustrative real spending change. Rough guide only.
A further point cuts against a price-only story. MoSPI’s August urban inflation (4.31%) was lower than rural inflation (5.23%). Urban households cut spending where measured price rises were smaller. Price level alone does not explain the urban result.
How EMIs squeeze money for everyday purchases
An EMI (equated monthly instalment) is a contractual claim on income, paid before discretionary spending. When EMIs take a larger share of income, less is left for groceries and other everyday items, even if prices and income are unchanged.
Three pieces of evidence bear on this.
• Household debt is rising and tilted to consumption. The RBI FSR reports household debt at 45.5% of GDP by end-September 2025. Non-housing retail loans were 58.4% of household borrowings in March 2026. Loans taken for consumption purposes account for nearly half of all household borrowing. The RBI counts personal loans, credit cards and consumer durable loans as consumption loans.
• Wallet mix. Consumer durables rose to about 6% of the Kharcha wallet from under 2%. Outlook Money’s coverage links higher durables borrowing to added EMI commitments for some rural households.
• Stress among borrowers seeking help. Business Today reports that, in data from the debt-resolution platform Expert Panel, 40% of borrowers used new loans or credit cards to manage existing EMIs. It also reports that 60% had EMIs equal to or above monthly family income. This is a company’s client data, covered under counter-evidence below.
Why rural spending growth is not the same as prosperity
Rural spending rose 15% to Rs 53,760 a quarter. Spending is an outflow. Prosperity concerns income, assets and debt. Spending can rise because incomes rose, because prices rose, or because households borrowed. Outlook Money’s coverage of Kharcha does not report rural income data.
What the sources do show:
• Rural inflation was 5.23% in August, above urban at 4.31%, with rural food inflation at 6.13% (MoSPI figures via Deccan Chronicle).
• Higher durables borrowing has added EMIs for some rural households, and uneven monsoon conditions could affect rural incomes and spending (Outlook Money). The RBI FSR projects a weak monsoon due to El Niño.
• In the previous edition, Kharcha 3.0 as reported by Outlook Money, spending in rural and lower-income homes rose 18% in a year, and the overall rise was attributed mainly to higher costs of essentials.
On illustrative arithmetic, 15% nominal growth against 5.23% rural CPI is still positive in real terms, at about 9%. The CPI basket differs from the Kharcha basket, so this is a rough guide. The open question is how the spending is financed.
Counter-evidence: what cuts against the budget-pressure reading
• The RBI sees contained risk. The FSR says domestic financial stability risks remain contained, and that borrower profiles have improved, with a rising share of prime and above borrowers. Gross NPA ratios at end-March 2026 were 0.7% for secured retail loans and 1.7% for unsecured retail loans.
• Aggregate consumption has been strong. The FSR reports 7.7% growth in 2025–26, supported by strong private consumption, and says high-frequency indicators for April–May 2026 pointed to continued resilience.
• Measured urban inflation is lower than rural. See above.
• The survey has limits. Kharcha covers about 6,000 households. The previous edition’s sample was described by the Tribune as primarily housewives who are key FMCG purchase decision-makers. Coverage also mixes “FMCG expenditure” with “household expenditure”, so definitions should be checked in Worldpanel’s primary report.
• Expert Panel’s sample is self-selected. Its clients are borrowers seeking debt resolution, so its 40% and 60% figures are not national rates.
• Not every segment is cutting back. Nestlé India’s chairman said in 2024, per Reuters, that people at the top end were spending freely. That is a dated executive statement. In the 2026 Kharcha data, affluent urban households also fell 4%.
The RBI adds a nuance on distribution. Its income-level survey of ten banks found personal-loan defaults contained and declining, yet the below-₹5 lakh income group generates a disproportionately large share of fresh NPAs relative to its share of new lending.
What household budget pressure means for businesses and policymakers
The points below are inferences from the evidence, plus options others have proposed.
For businesses (inference):
• The wallet is shifting. The groceries share fell while durables rose. Exposure depends on which category a firm sits in.
• Credit-linked demand carries repayment risk. Durables bought on EMI depend on repayment capacity, which the Expert Panel data suggest is stretched for some borrowers.
• Urban and rural paths diverge. A single national consumer assumption would miss a 19-point gap between rural (+15%) and urban (−4%) spending growth in the same quarter.
• Pack and price architecture matters. Hindustan Unilever and Parle reported smaller-pack demand (company statements, January 2025).
For policymakers (options attributed): Sanskriti IAS lists five options for Budget 2026–27: raise disposable incomes through targeted support and tax relief, promote labour-intensive employment, add selective revenue spending beside capital expenditure, incentivise financial savings, and align consumption growth with incomes rather than debt. These are that outlet’s proposals, not COSMINNOX positions. Primary data could also help. Business Standard’s NSO topic page lists a household income survey announced from February 2026 and a new Debt and Investment Survey in 2026. Both would test the readings above.
Conclusion: what the evidence does and does not establish
On household budget pressure, the evidence establishes that, in Worldpanel’s survey, urban household FMCG spending fell 4% in Q1 FY27 while MoSPI recorded rising retail inflation, reaching 4.82% in August 2026. It establishes that rural spending grew 15% in the same survey, that consumer durables’ share of the wallet rose to about 6%, and that the RBI puts household debt at 45.5% of GDP, with nearly half of household borrowing for consumption.
It does not establish which channel matters most. It does not show a household debt crisis; the RBI describes stability risks as contained while flagging the borrowing trend. It does not show that rural spending growth reflects rising incomes.
To test these readings yourself, start with the primary sources linked above: MoSPI’s CPI release, the RBI’s Financial Stability Report and Worldpanel’s Kharcha report. Compare their definitions before comparing their numbers.
India’s Household Budget Squeeze: Why Urban Spending Is Falling as Prices and EMIs Bite
The Worldpanel Kharcha report provides a detailed picture of how Indian households allocate their money and respond to financial pressure. According to Outlook Money’s coverage, its fourth edition draws on approximately 6,000 urban and rural households, with fieldwork conducted in April 2026. Beyond measuring expenditure, the survey examines how household budgets are divided between categories and how consumers feel about essentials, fuel prices and their financial circumstances. Its value lies in connecting spending figures with everyday decisions: what families continue to buy, what they postpone and where they make adjustments when money becomes harder to manage.
The reported findings show a clear difference between urban and rural expenditure. Both affluent and less affluent urban households recorded a 4% year-on-year decline in spending, despite having different average quarterly outlays of ₹81,759 and ₹49,832 respectively. Rural household expenditure, meanwhile, increased by 15%. The contraction across both urban income groups suggests that caution extends beyond households with the smallest budgets. However, these figures measure expenditure rather than purchasing power. Higher rural spending could reflect increased purchases, higher prices or changes in the household basket, so it should not automatically be interpreted as improved financial wellbeing.
Inflation helps explain why households can feel financially constrained even when their income remains unchanged or rises modestly. The cited MoSPI provisional figures put retail inflation at 4.82% in August 2026, compared with 4.45% in July, while food inflation stood at 5.95%. Rural and urban inflation were reported at 5.23% and 4.31% respectively. These percentages describe increases in prices compared with the corresponding period a year earlier; they do not mean every product became costlier by the same amount. A family spending a large proportion of its income on food may experience greater pressure than the overall inflation rate suggests. As essential expenses absorb more money, households have less flexibility to purchase clothes, packaged snacks, leisure services or other items they can postpone. The September inflation figure was unavailable at the article’s stated time of writing.
Debt repayments can intensify this pressure because they commit part of household income before other spending decisions are made. The cited June 2026 RBI Financial Stability Report places household debt at 45.5% of GDP while assessing domestic financial stability risks as contained and noting improvements in borrower profiles. This distinction is important: pressure on individual household budgets does not, by itself, establish a nationwide debt crisis. Nevertheless, the reported composition of borrowing deserves attention, with non-housing retail loans accounting for 58.4% and consumption loans representing nearly half. When borrowing finances purchases that generate no additional income, repayments must come from existing earnings, potentially reducing the money available for groceries, savings and unexpected expenses.
Changes in the household spending mix reveal how these competing demands affect purchasing decisions. According to the cited Kharcha coverage, groceries accounted for 22% of the household wallet, down from 23.5% a year earlier, while consumer durables increased their share to approximately 6% from under 2%. This indicates a change in the distribution of expenditure, but a falling share does not necessarily mean that the rupee amount spent on groceries declined. Grocery expenditure could increase while its share falls if total spending grows faster. Similarly, a large appliance purchase can temporarily lift the share of durables, while any associated EMI payments may constrain subsequent spending. Establishing precisely which categories lost expenditure requires more detailed data than these wallet-share figures alone provide.
Understanding the difference between nominal and real spending is therefore essential. Nominal expenditure is the amount paid in rupees, while real expenditure adjusts for price changes to estimate the volume of goods and services purchased. For example, if a household previously spent ₹1,000 on a particular basket and now spends ₹960, its nominal expenditure has fallen by 4%. If the price of that same basket has also risen by 5%, its purchasing volume would be approximately 8.6% lower, assuming the basket remains comparable. This is an illustration, not an estimate from the survey. It shows why falling expenditure during inflation can signal a sharper reduction in purchases than the spending figure initially suggests.
Evidence about borrowing to meet existing repayments adds another dimension, although its scope must be stated carefully. Business Today’s cited coverage of Expert Panel’s data reports that 40% of borrowers used new loans or credit cards to manage existing EMIs. This finding concerns clients of a debt-resolution platform—people already seeking assistance—and cannot be treated as the proportion of all Indian borrowers doing so. Within that group, however, it illustrates how repayment difficulties can lead households to depend on further credit. Additional borrowing may provide temporary relief while creating future obligations, leaving even less room for ordinary purchases. Read alongside the spending findings, this highlights the importance of examining prices, earnings and debt commitments together when assessing household financial wellbeing.
References
1. Worldpanel Kharcha (4th annual), as reported by Outlook Money, 2 October 2026: https://www.outlookmoney.com/news/urban-spending-falls-4-per-cent-as-rural-households-drive-consumer-spending-growth
2. RBI, Financial Stability Report, June 2026, Chapter I (30 June 2026): https://m.rbi.org.in/Scripts/PublicationReportDetails.aspx?ID=1324
3. MoSPI, Press Release of CPI for August 2026 (base 2024=100), 14 September 2026: https://www.mospi.gov.in/uploads/latestreleasesfiles/1789382372004-Press%20Release%20of%20CPI%20for%20August%202026.pdf
4. Deccan Chronicle on MoSPI CPI data, September 2026: https://www.deccanchronicle.com/amp/nation/retail-inflation-for-august-2026-rises-to-482pc-telangana-tops-the-list-with-627pc-1987572
5. DT Next, “Retail inflation rises to 4.82 pc in August”: https://www.dtnext.in/news/business/retail-inflation-rises-to-482-pc-in-august
6. CNBC-TV18, “84% of Indian households feel budget pressure as urban consumption slows: Worldpanel report”: https://www.cnbctv18.com/market/84-percent-indian-households-feel-budget-pressure-urban-consumption-slows-worldpanel-report-fmcg-debt-inflation-higher-fuel-manoj-menon-emi-rainfall-monsoon-20002995.htm
7. Business Today, “40% of borrowers are taking fresh loans to repay existing EMIs”, 22 September 2026: https://www.businesstoday.in/personal-finance/story/40-of-borrowers-are-taking-fresh-loans-to-repay-existing-emis-why-festive-credit-can-deepen-debt-557037-2026-09-22
8. Sanskriti IAS, “India’s Household Balance Sheet Under Strain” (summarising RBI Annual Report 2024–25): https://www.sanskritiias.com/current-affairs/indias-household-balance-sheet-under-strain-the-silent-risk-before-union-budget-2026
9. Outlook Money, Kharcha 3.0 coverage: https://www.outlookmoney.com/personal-finance/nearly-60-per-cent-families-finding-it-difficult-to-manage-monthly-expenses-says-report
10. The Tribune, Kharcha 3.0 coverage: https://www.tribuneindia.com/news/business/indian-household-quarterly-spending-rises-33-to-rs-56000-in-2025-report
11. Business Standard, “Pockets and packets shrink as urban consumers face budget squeeze”, January 2025: https://www.business-standard.com/amp/industry/news/small-packs-big-impact-urban-buyers-downsize-amid-budget-squeeze-125012301319_1.html
12. Reuters via Zawya, “India’s middle class tightens its belt”, 2024: https://www.zawya.com/en/news/insights/indias-middle-class-tightens-its-belt-squeezed-by-food-inflation-q36rfwip
13. Business Standard, NSO topic page: https://www.business-standard.com/topic/nso
Correction protocol: any post-publication change to a figure will carry a dated correction note. This article is analysis, not investment, financial or legal advice.