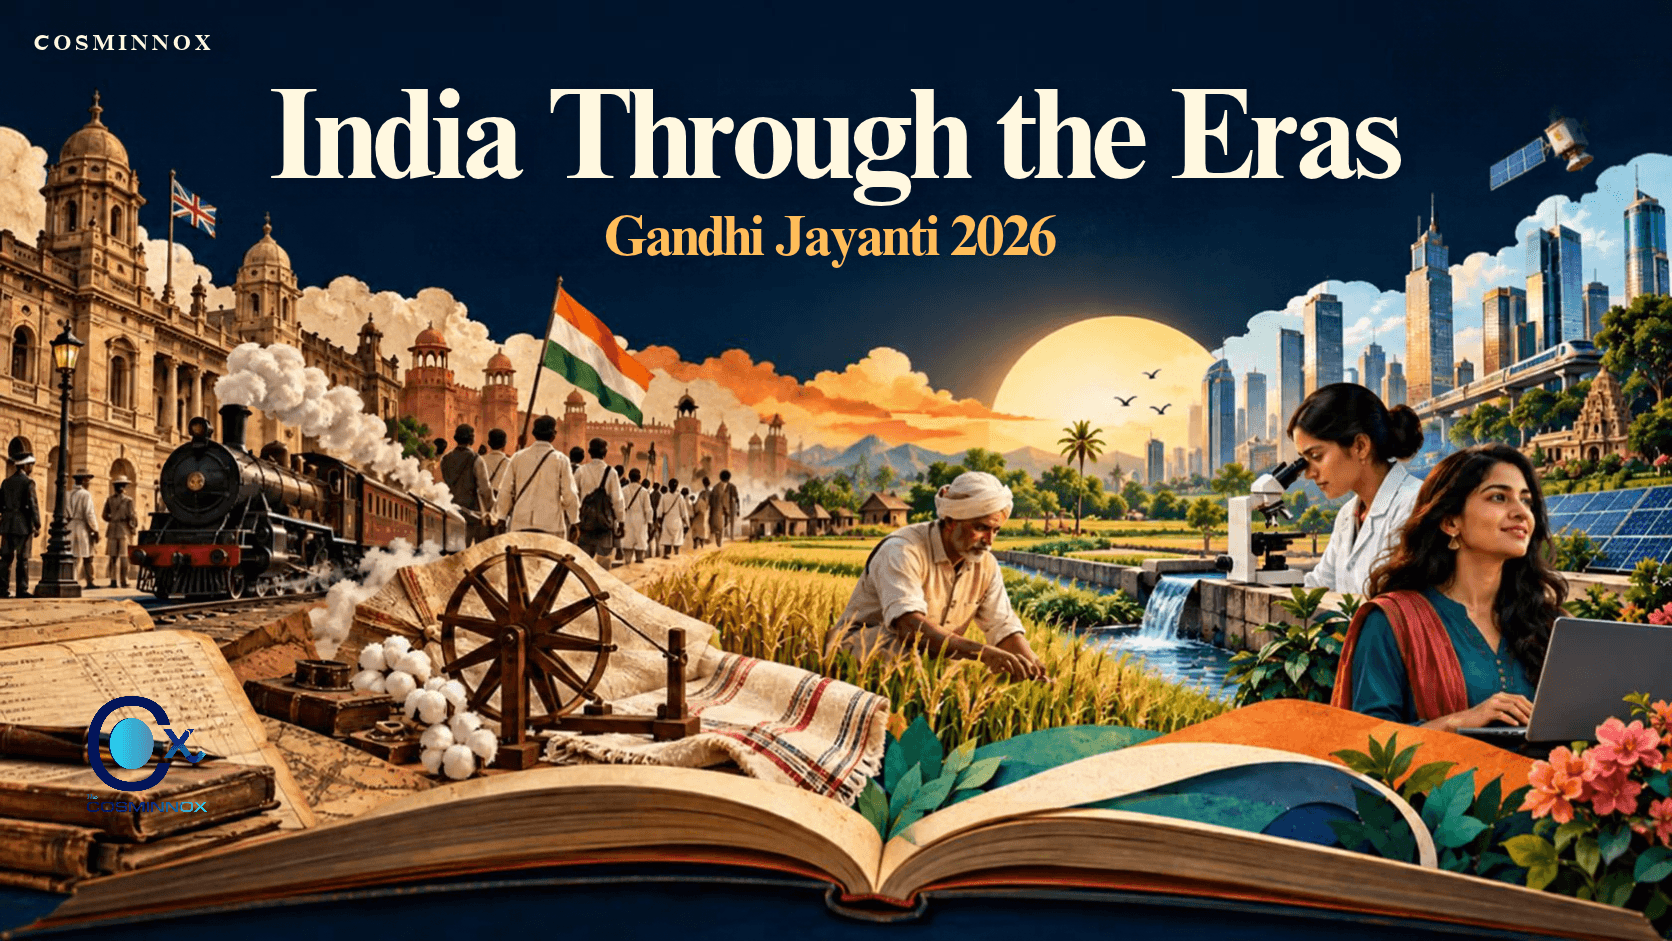
Gandhi Jayanti 2026 invites a measurable question: how far have India's official indicators moved since the era of Mahatma Gandhi and Lal Bahadur Shastri, and where do those indicators stop being comparable? This analysis examines three series, literacy, extreme poverty and GDP, using published statistics as of 1 October 2026. The evidence shows large recorded changes in literacy and monetary poverty, a GDP ranking that depends on the measure used, and gaps that national averages conceal. Each figure is tied to a checkable source, and contested points show both sides.
Gandhi Jayanti 2026 falls on Friday, 2 October. It marks Mahatma Gandhi's 157th and Lal Bahadur Shastri's 122nd birth anniversary. The date is also the United Nations International Day of Non-Violence, which the General Assembly established in 2007 to promote non-violence through education and public awareness.
[Chart placeholder: Timeline of 2 October anniversaries: Gandhi (1869), Shastri (1904), UN observance (2007)]
Gandhi Jayanti 2026: Two Birth Anniversaries and One UN Observance
Mahatma Gandhi was born on 2 October 1869, and Lal Bahadur Shastri on 2 October 1904. Shastri served as Prime Minister from June 1964 to January 1966, a period that included the 1965 war with Pakistan and pressure on food supplies.
The United Nations marks the same date as the International Day of Non-Violence under General Assembly resolution A/RES/61/271, adopted in June 2007. The resolution invites governments and organisations to spread the message of non-violence through education and public awareness.
Gandhi Jayanti is observed as a national holiday in India. Workplaces and educational institutions publish their own calendars, so readers should check the relevant institutional notice rather than assume a closure.
How to Read India's Historical Statistics Before Comparing Eras
Two debates show why historical comparisons need care before any 2026 number is placed beside an older one.
The "drain of wealth" estimate
Economist Utsa Patnaik has argued that colonial arrangements moved a very large value from India to Britain. In an interview with Janata Weekly, she put the 1765–1938 total at £9.2 trillion, about $45 trillion, using India's export surplus as the measure and compounding it at 5% interest. The total therefore depends on two choices: the measure and the rate. A different measure or rate would produce a different sum.
A historical chart of India's share of world GDP describes relative output. It does not by itself measure transfers between countries.
The Bengal famine of 1943
Amartya Sen's entitlement approach, set out in his 1981 book Poverty and Famines, holds that people can starve when they lose the income or access needed to obtain food, even where supply exists. Other scholars examine wartime inflation, procurement, transport restrictions and administrative decisions. These explanations can overlap, and a single-cause reading is not supported by the range of scholarship.
Literacy: From 18.33% in 1951 to 81.1% in 2025
Literacy is among the longest-running development series India publishes, which makes it a natural first test for any Gandhi Jayanti 2026 comparison. The table lists the main benchmarks.
Year | Literacy rate | Source | Basis |
1951 | 18.33% (some official summaries show 18.32%) | Census of India | Census |
1961 | 28.30% | Census of India | Census |
2011 | 74.04% | Census of India, as reported by DD India | Census |
2023–24 | 80.9% (age 7 and above) | PLFS Annual Report 2023–24 | Household survey |
2025 | 81.1% | PLFS Annual Report 2025, as reported by DD India | Revamped household survey |
Figures as of 1 October 2026.
[Chart placeholder: Line chart of India's literacy rate, Census 1951–2011 and PLFS 2023–25, with a break marking the change of method]
These numbers should not be read as one continuous series. The Ministry of Statistics and Programme Implementation states that the PLFS sampling design changed from January 2025 and that users should account for this when comparing with earlier releases. Census rounds and sample surveys also use different methods, and the earliest Census benchmarks covered different age groups.
Extreme Poverty: 5.3% in 2022–23 at the $3-a-Day Line
Poverty is the second test. The World Bank estimates that India's extreme poverty rate fell from 27.1% in 2011–12 to 5.3% in 2022–23 at a threshold of $3 a day in 2021 purchasing-power terms. In absolute numbers, the reported figure fell from 344.47 million to 75.24 million people.
The result depends on the line chosen. The table shows the same period under three World Bank thresholds.
Threshold | 2011–12 | 2022–23 |
$2.15 a day (2017 prices) | 16.2% | 2.3% |
$3.00 a day (2021 prices) | 27.1% | 5.3% |
$4.20 a day (lower-middle-income line) | 57.7% | 23.9% |
Source: World Bank estimates as reported by The Tribune and Diya TV. Figures as of 1 October 2026.
[Chart placeholder: Bar chart comparing India's poverty rate at three World Bank thresholds in 2011–12 and 2022–23]
India's GDP Rank in 2026: Why Sources Disagree
Claims about India's GDP position conflict because they draw on different IMF editions, measures and years.
• Nominal GDP, IMF April 2026 edition. Business Standard reports India at about $4.15 trillion for 2026, below the United Kingdom's $4.26 trillion, placing India sixth. The same report attributes the shift to exchange-rate movements and a revision of the GDP base year.
• Purchasing-power parity. Statistics Times, drawing on the same IMF edition, lists India third after the United States and China.
• Earlier projections. The IMF's April 2025 edition projected India narrowly ahead of Japan, and government statements in 2025 described India as the fourth-largest economy, as recorded by The Wire.
A precise claim about India's 2026 rank should therefore name the IMF edition, the measure (nominal or PPP) and the year.
[Chart placeholder: Bar chart of 2026 nominal GDP for India, the UK and Japan, IMF April 2026 edition]
Counter-Evidence: What the Headline Figures Do Not Show
The strongest qualification to the Gandhi Jayanti 2026 progress figures comes from the same datasets.
The poverty line changes the answer. At the $4.20 line, 23.9% of the population was below the threshold in 2022–23, against 5.3% at $3. Data for India's explainer converts the two lines to roughly ₹84 and ₹60 per person per day.
Non-monetary measures differ by source. The World Bank reports a multidimensional poverty rate of 15.5% for 2022–23, as reported by Organiser. NITI Aayog's index, cited in a Deccan Herald analysis, shows 11.3% for the same year. The two use different methods.
National literacy hides large gaps. Under PLFS 2025, literacy among people aged 7 and above was 89% in urban areas and 77.4% in rural areas. Rural female literacy was 70.3%, against 93.1% for urban males, according to DD India's summary. The Department of School Education and Literacy treats 95% as the threshold for a State or Union Territory to count as fully literate.
Totals do not describe household security. A poverty line records consumption below a threshold. It does not record whether a household can absorb illness, job loss or an unexpected expense.
Gandhi and Shastri: Measuring Progress Through People’s Lives
Gandhi Jayanti offers an opportunity to reflect on what progress means for India. Gandhi’s emphasis on dignity and local livelihoods, alongside Lal Bahadur Shastri’s concern for farmers and national resilience, invites us to look beyond the size of the economy. Rural incomes, access to education and food security help reveal how national development translates into everyday well-being.
The poverty figures cited here suggest considerable improvement. According to World Bank estimates reported by Deccan Herald, rural extreme poverty under the earlier $2.15-a-day threshold fell from 18.4% in 2011–12 to 2.8% in 2022–23. Urban poverty declined from 10.7% to 1.1% over the same period, narrowing the rural–urban divide.
Yet progress has been uneven. The literacy figures cited for 2025 continue to show differences between rural and urban communities and between women and men. Read together, these indicators suggest that poverty reduction and educational advancement have moved at different speeds. Gandhi’s and Shastri’s legacies offer a useful perspective: development gains matter most when they expand people’s opportunities and strengthen their security.
India’s Progress—and the Work Ahead
The figures presented in this article describe substantial changes in India’s education, poverty levels and economic scale. Recorded literacy increased from 18.33% in the 1951 Census to the cited 81.1% in PLFS 2025. Because these figures come from different methods, they illustrate the broad scale of change rather than an exact, uninterrupted statistical trend.
The poverty estimates also point to improvement. Under the World Bank’s newer $3-a-day international extreme-poverty threshold, the cited rate fell from 27.1% in 2011–12 to 5.3% in 2022–23. This measure should be distinguished from the earlier $2.15 threshold used in the rural–urban comparison above.
India’s economic position adds another dimension. The IMF’s April 2026 estimates, as cited in this article, place India sixth by nominal GDP and third by purchasing-power parity. These rankings describe economic scale; literacy, incomes and household security help explain how that scale is experienced by people.
Taken together, the figures provide reasons to recognise progress while remaining attentive to persistent inequalities. They do not, by themselves, explain the causes of change or establish how financially secure households are once they move above a poverty threshold.
On Gandhi Jayanti 2026, the larger question is how India can turn economic growth into wider access to education, dependable livelihoods and a life of dignity. That question connects the achievements discussed here with the aspirations associated with both Gandhi and Shastri.
Readers can explore the underlying figures through MoSPI’s PLFS publications, the IMF’s World Economic Outlook database and the World Bank’s poverty data. The COSMINNOX think-tank series will continue examining these connections between national development and everyday life.
Data note: This article uses figures cited as available on 1 October 2026. Any subsequent revisions will be recorded in a dated update.
Understanding the Figures Behind the Story
Why does 2 October carry a special significance?
The date marks the birth anniversaries of Mahatma Gandhi and Lal Bahadur Shastri. Gandhi Jayanti is observed as a national holiday in India and falls on Friday in 2026. The United Nations also observes 2 October as the International Day of Non-Violence, established in 2007 to encourage education and public awareness around non-violence.
How does Shastri’s legacy connect with this discussion?
Lal Bahadur Shastri, born on 2 October 1904, served as India’s Prime Minister from June 1964 to January 1966. His leadership during the 1965 war and a period of pressure on food supplies gives particular relevance to questions of agricultural livelihoods, food security and national resilience.
What can the literacy figures tell us?
The 1951 and 2025 figures offer a broad view of educational advancement, but they should be read with care. The earlier figure comes from the Census, while the later figure comes from a household survey. Differences in coverage and methodology mean they cannot be treated as a single continuous series.
What does the $3-a-day poverty threshold measure?
The World Bank’s $3 threshold measures extreme poverty using 2021 purchasing-power parity, which accounts for differences in prices across countries. It is not a direct conversion at the market exchange rate. The cited estimate places India’s poverty rate at 5.3% in 2022–23 under this threshold, compared with 23.9% under the higher $4.20 threshold. The difference shows why the choice of poverty line matters.
Why do reports give different rankings for India’s economy?
Rankings depend on the measure, the year and the edition of the estimates being used. Nominal GDP and purchasing-power parity measure economic size differently, while projections can change between releases. The April 2026 IMF edition cited here places India sixth by nominal GDP and third by purchasing-power parity. Any ranking should therefore identify its source and measure.
How should readers understand the “drain of wealth” theory?
The theory argues that colonial taxation and trade arrangements transferred wealth from India to Britain. Utsa Patnaik’s widely discussed estimate of approximately $45 trillion for 1765–1938 uses a calculation that compounds export surpluses at 5% interest. It should be understood as an estimate dependent on that method, rather than a directly recorded total.