
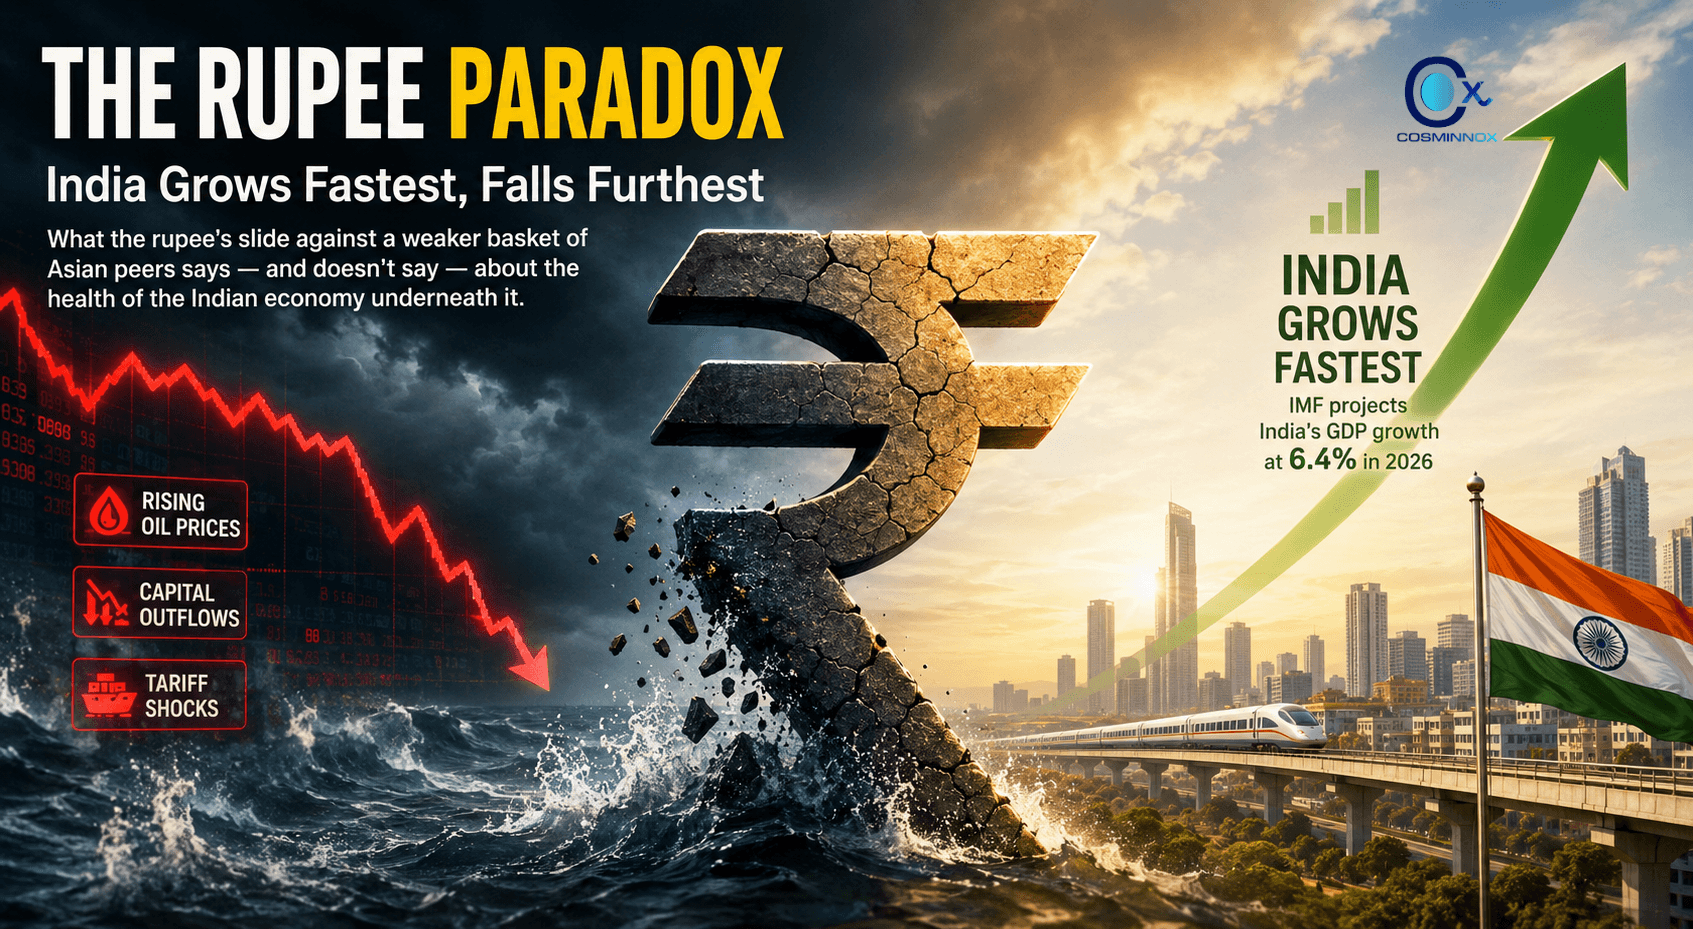
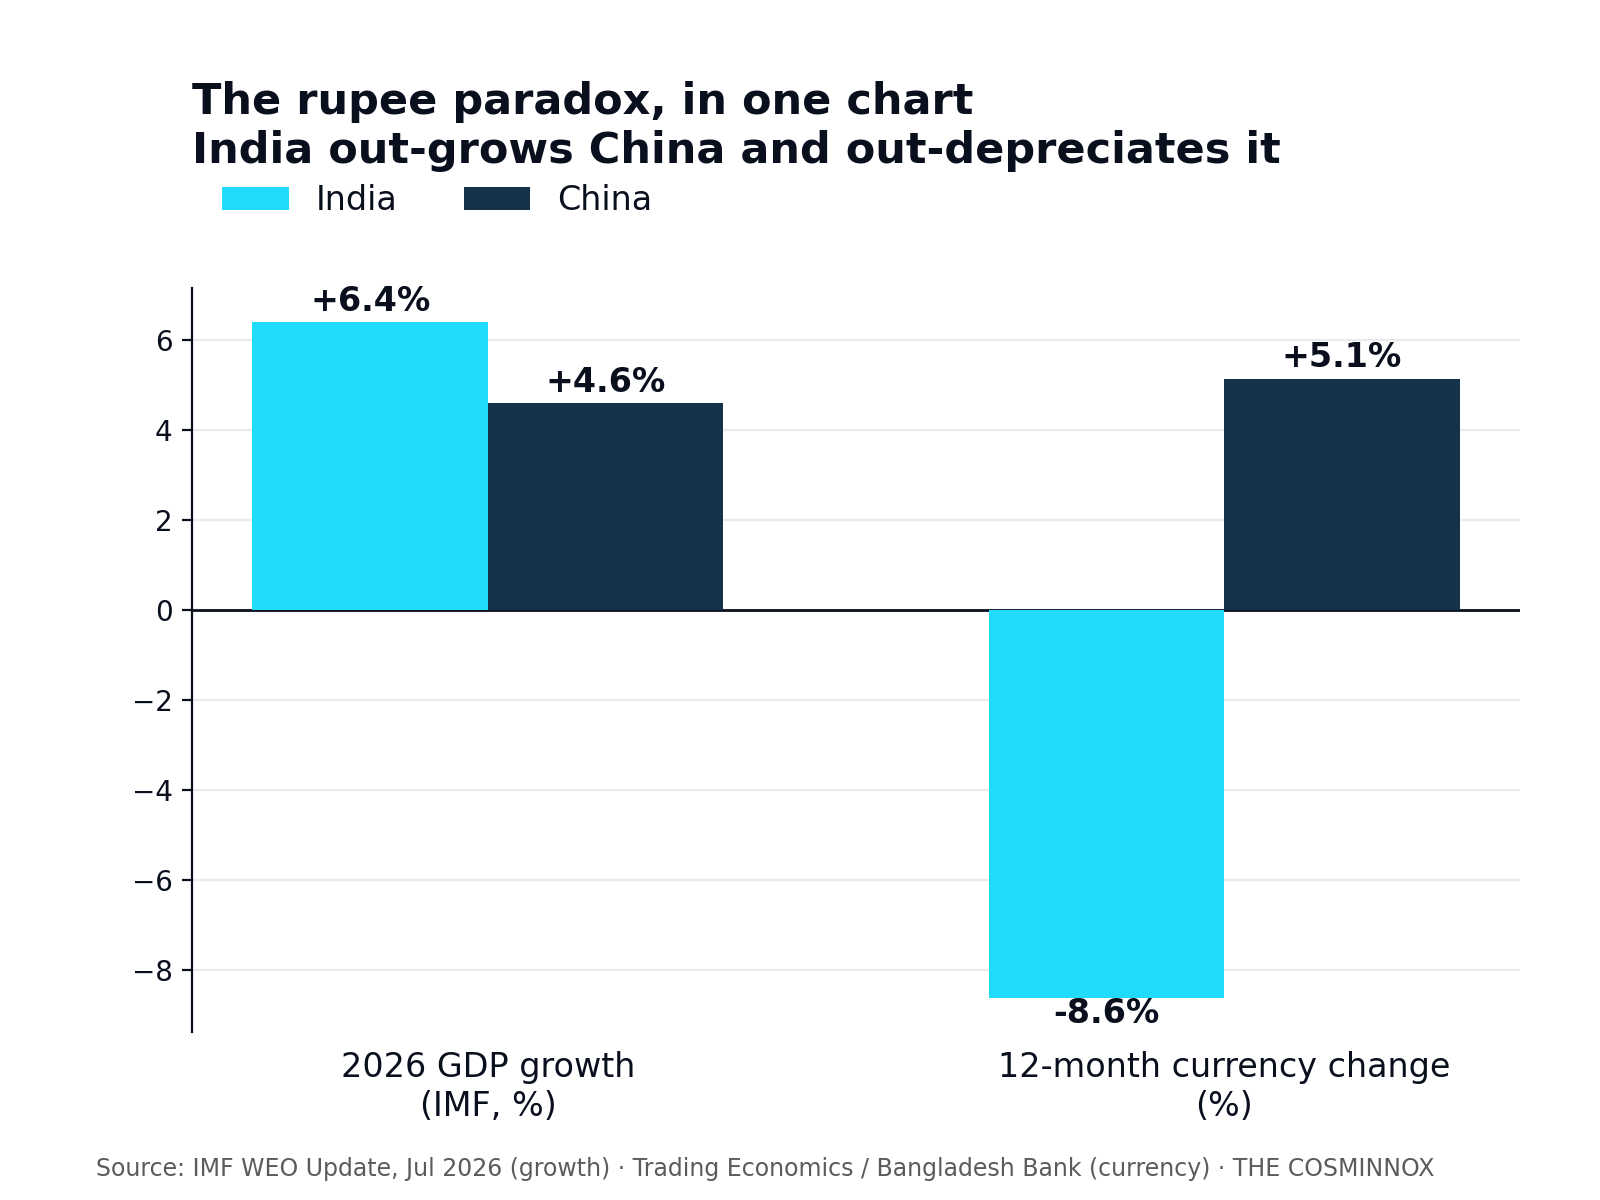
In calendar year 2026, India has run two macroeconomic stories at once that do not obviously belong together. By one measure, it is the strongest performer among major economies: the International Monetary Fund's July 2026 World Economic Outlook update projects India will grow 6.4 percent this year, ahead of China's 4.6 percent and every other economy in the G20. (IMF WEO Update, July 2026) By another measure, it is the weakest: the rupee has been Asia's worst-performing currency for a second consecutive year, falling from roughly ₹89.9 per dollar in January to a record low near ₹96.3–96.8 in May, before partially recovering to trade around ₹95.1–95.2 by early August. (Trading Economics, August 2026) The question this piece answers is not whether the rupee is weak — that is not in dispute — but what the weakness is actually evidence of: a genuine erosion of India's external position, a spillover from a global oil and capital-flow shock that has hit nearly every emerging-market currency, or some combination where the two are harder to separate than headlines suggest.
The Numbers: Two Rankings, Same Country
On growth, India's position is not contested. The IMF's July 2026 update kept India "among the fastest-growing major economies," citing private consumption and services momentum, while projecting China's growth to slow to 4.6 percent on higher oil prices and structural headwinds. (IMF WEO Update, July 2026) India's own National Statistics Office had earlier revised full-year FY26 real GDP growth up to 7.6 percent, above the initial 7.4 percent advance estimate, on strong Q3 services output and government capital expenditure. (Statistics of the World, citing MoSPI, August 2026)
On the currency, the picture inverts. Trading Economics data puts the rupee at 95.24 per dollar on August 10, 2026 — down 8.63 percent over the preceding twelve months even after a 0.69 percent recovery over the prior month. (Trading Economics, August 2026) Business Standard, citing NSDL depository data, reported the rupee had weakened close to 6 percent since the start of 2026 and around 10 percent over the trailing year as of mid-June, alongside record foreign portfolio outflows. (Business Standard, June 2026)
India is growing faster than every other major economy and depreciating faster than every other major Asian currency in the same calendar year — a combination its neighbours are not replicating.
What Is Pushing the Rupee Down
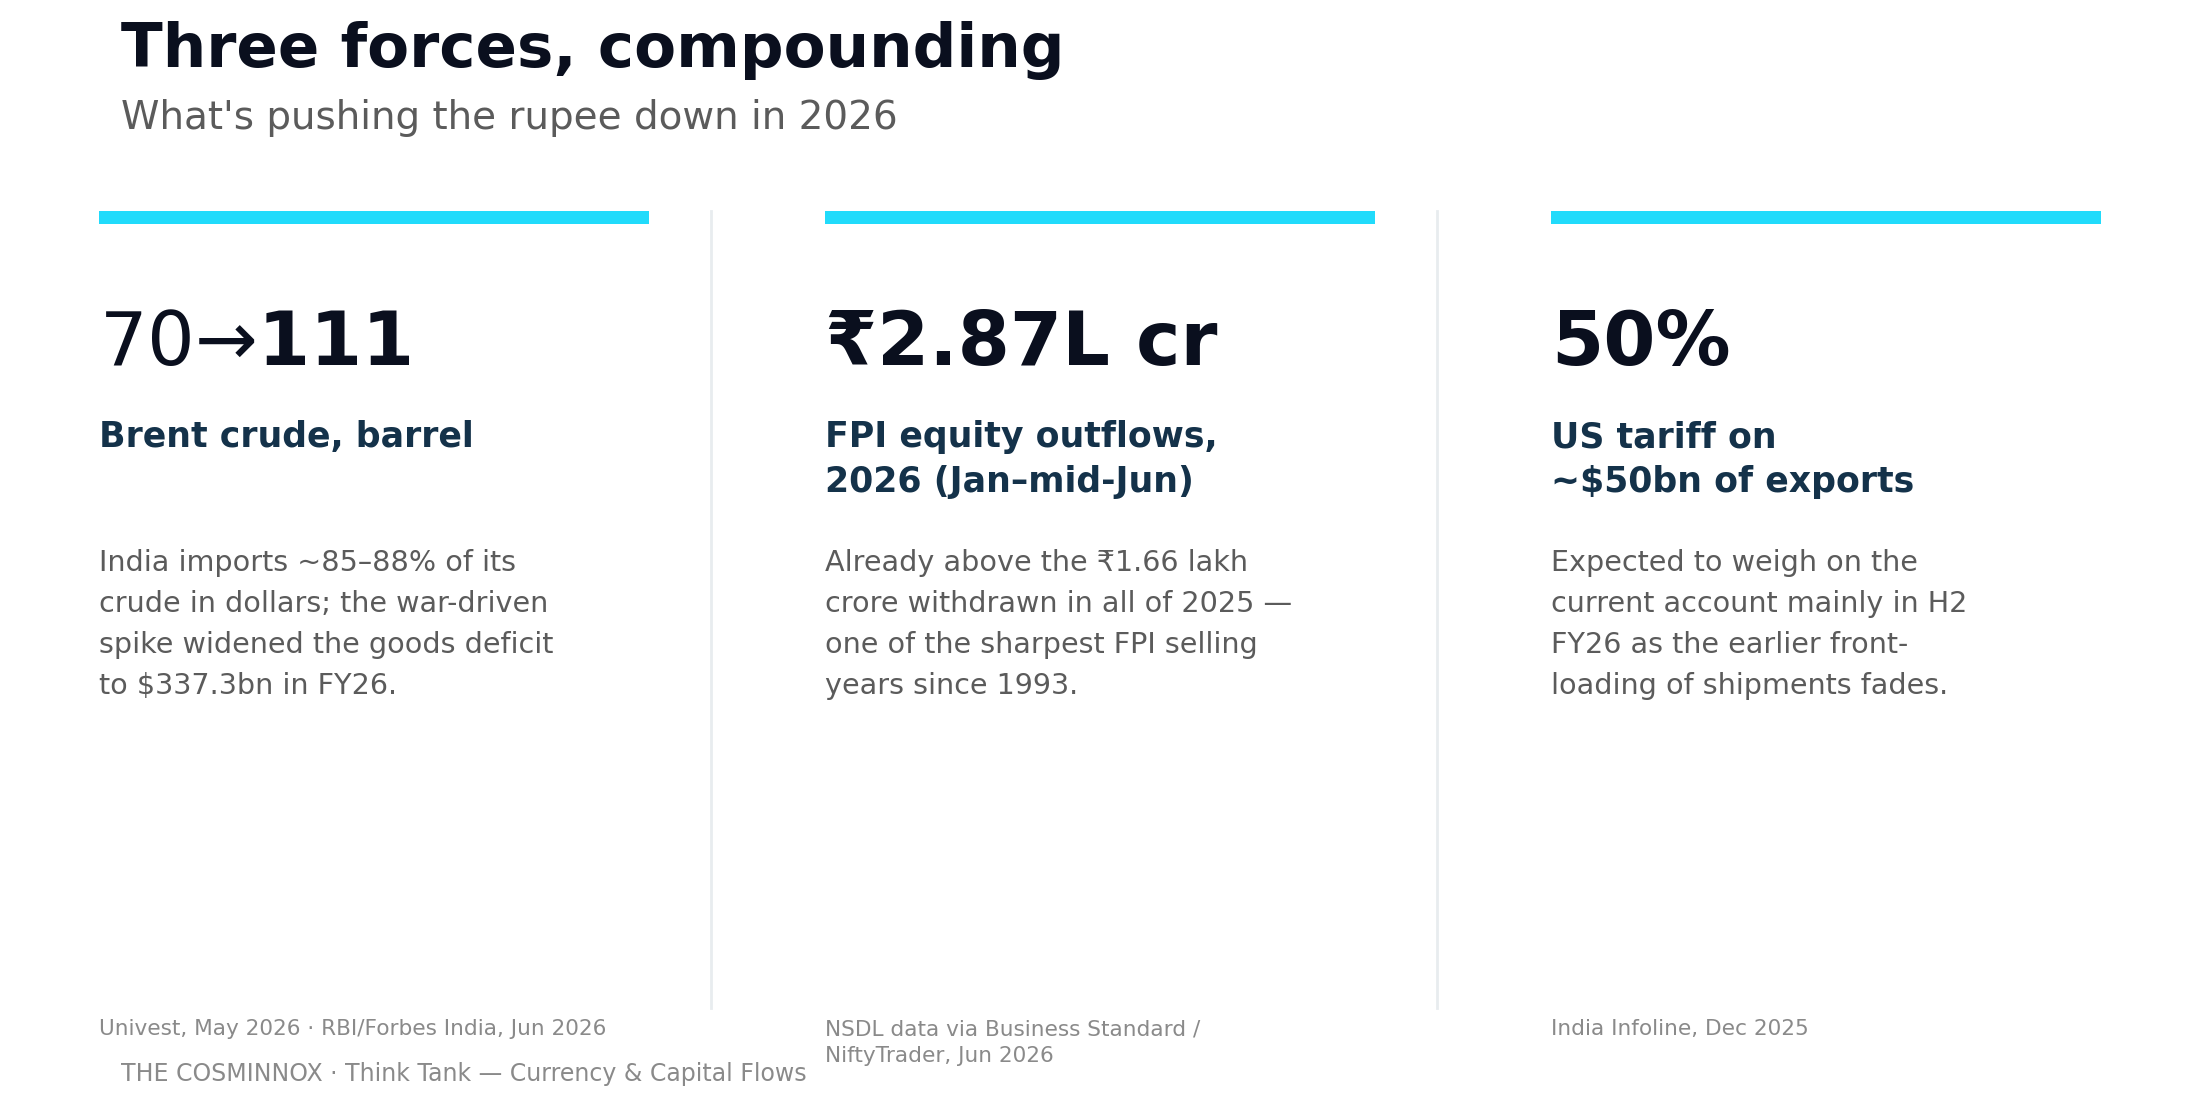
Three forces dominate the reporting, and they compound rather than operate independently.
Oil. India imports roughly 85–88 percent of its crude requirement in dollars. Brent crude rose from below $70 a barrel in early 2026 to a range of $109–111 in May, driven by the West Asia conflict, before easing back to around $83 by early August on signs of a de-escalation. (Univest, May 2026; Trading Economics, August 2026) The RBI's own current account data shows the mechanism directly: India's goods trade deficit widened to $337.3 billion for FY26 from $286.9 billion in FY25, even as the services surplus and remittances grew, because debits on the goods account rose 12 percent to $196.6 billion in the final quarter alone. (Forbes India, citing RBI data, June 2026)
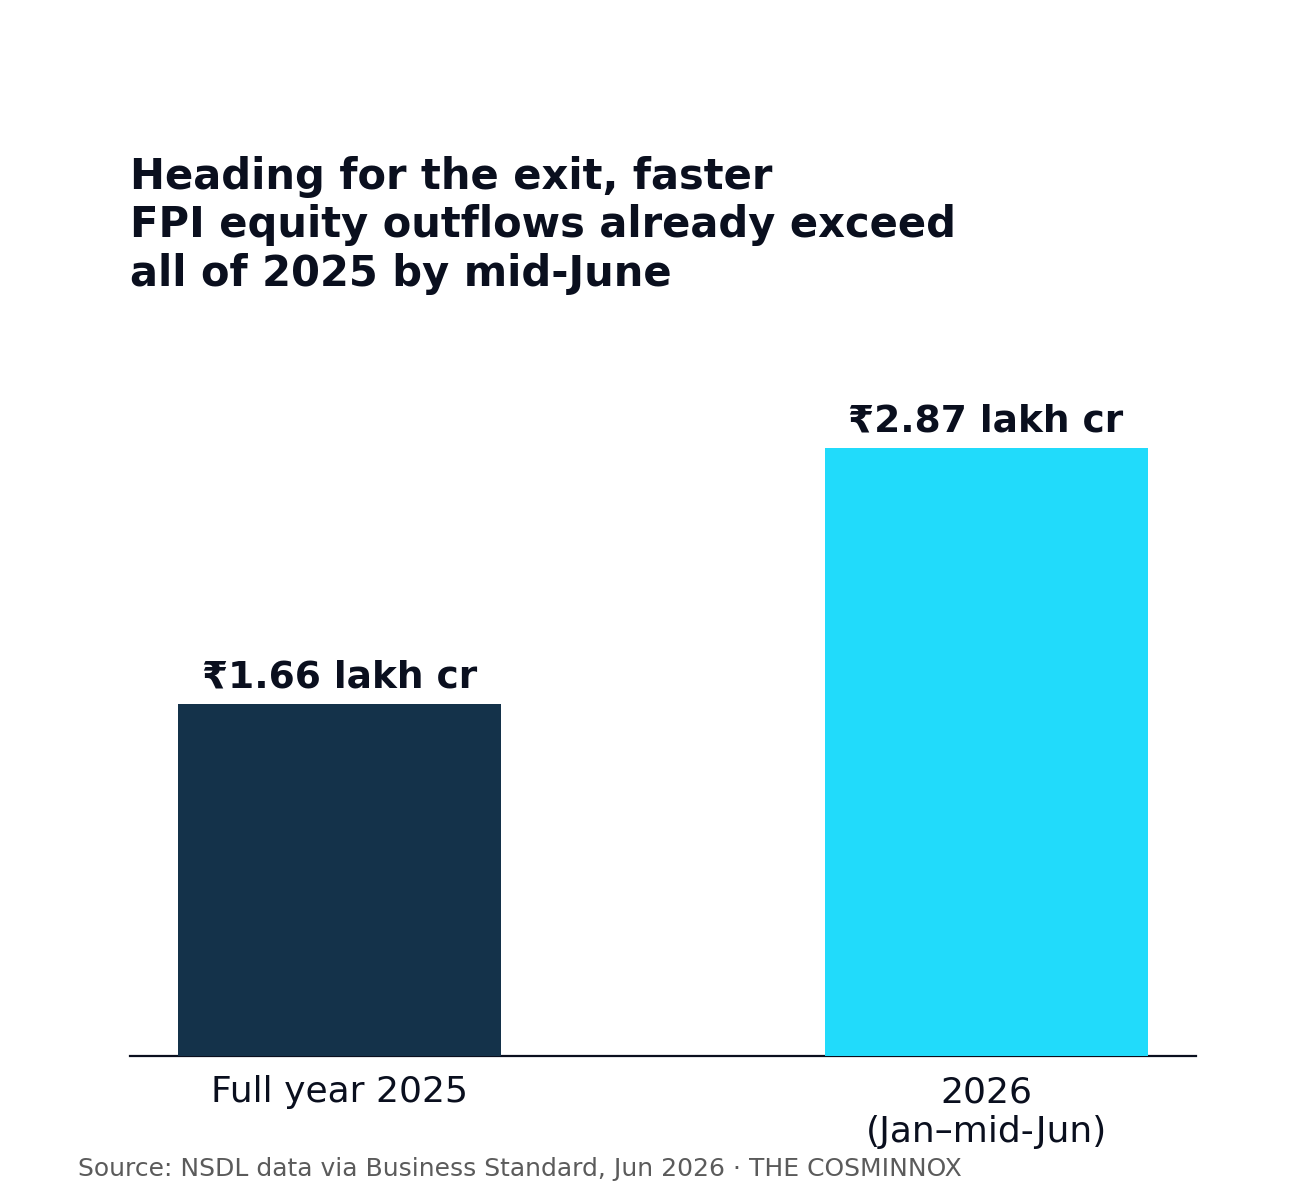
Capital outflows. Foreign portfolio investors withdrew a net $16.4 billion from Indian equity and debt markets in FY26, against inflows of $3.6 billion in FY25 — a reversal the RBI's own external-balance data attributes to "a globally risk-averse climate due to the West Asia conflict." (IMPRI Impact and Policy Research Institute, August 2026) On the equity side alone, NSDL data cited by Business Standard put cumulative 2026 outflows at ₹2.87 lakh crore (roughly $33 billion) by mid-June, already exceeding the ₹1.66 lakh crore withdrawn in the whole of 2025 and marking one of the sharpest selling years since FPIs were first permitted to invest in Indian equities in 1993. (Business Standard / NiftyTrader, citing NSDL data, June 2026)
Tariffs. The United States imposed tariffs reported at up to 50 percent on a category of Indian exports estimated at roughly $50 billion, a shock India Infoline's research desk expected to weigh on the current account mainly in the second half of FY26 as the earlier front-loading of shipments faded. (India Infoline, December 2025) CareEdge Ratings, by contrast, projected FY26 CAD at a more manageable 0.9 percent of GDP, noting that electronics — roughly 30 percent of India's US-bound exports — were tariff-exempt and that exports to the US had in fact grown 22 percent year-on-year in Q1 FY26. (DD News, citing CareEdge Ratings) The two estimates are not strictly comparable — they were published at different points in the year — but they illustrate a real forecasting range rather than a settled number.
How India Compares to Its Neighbours
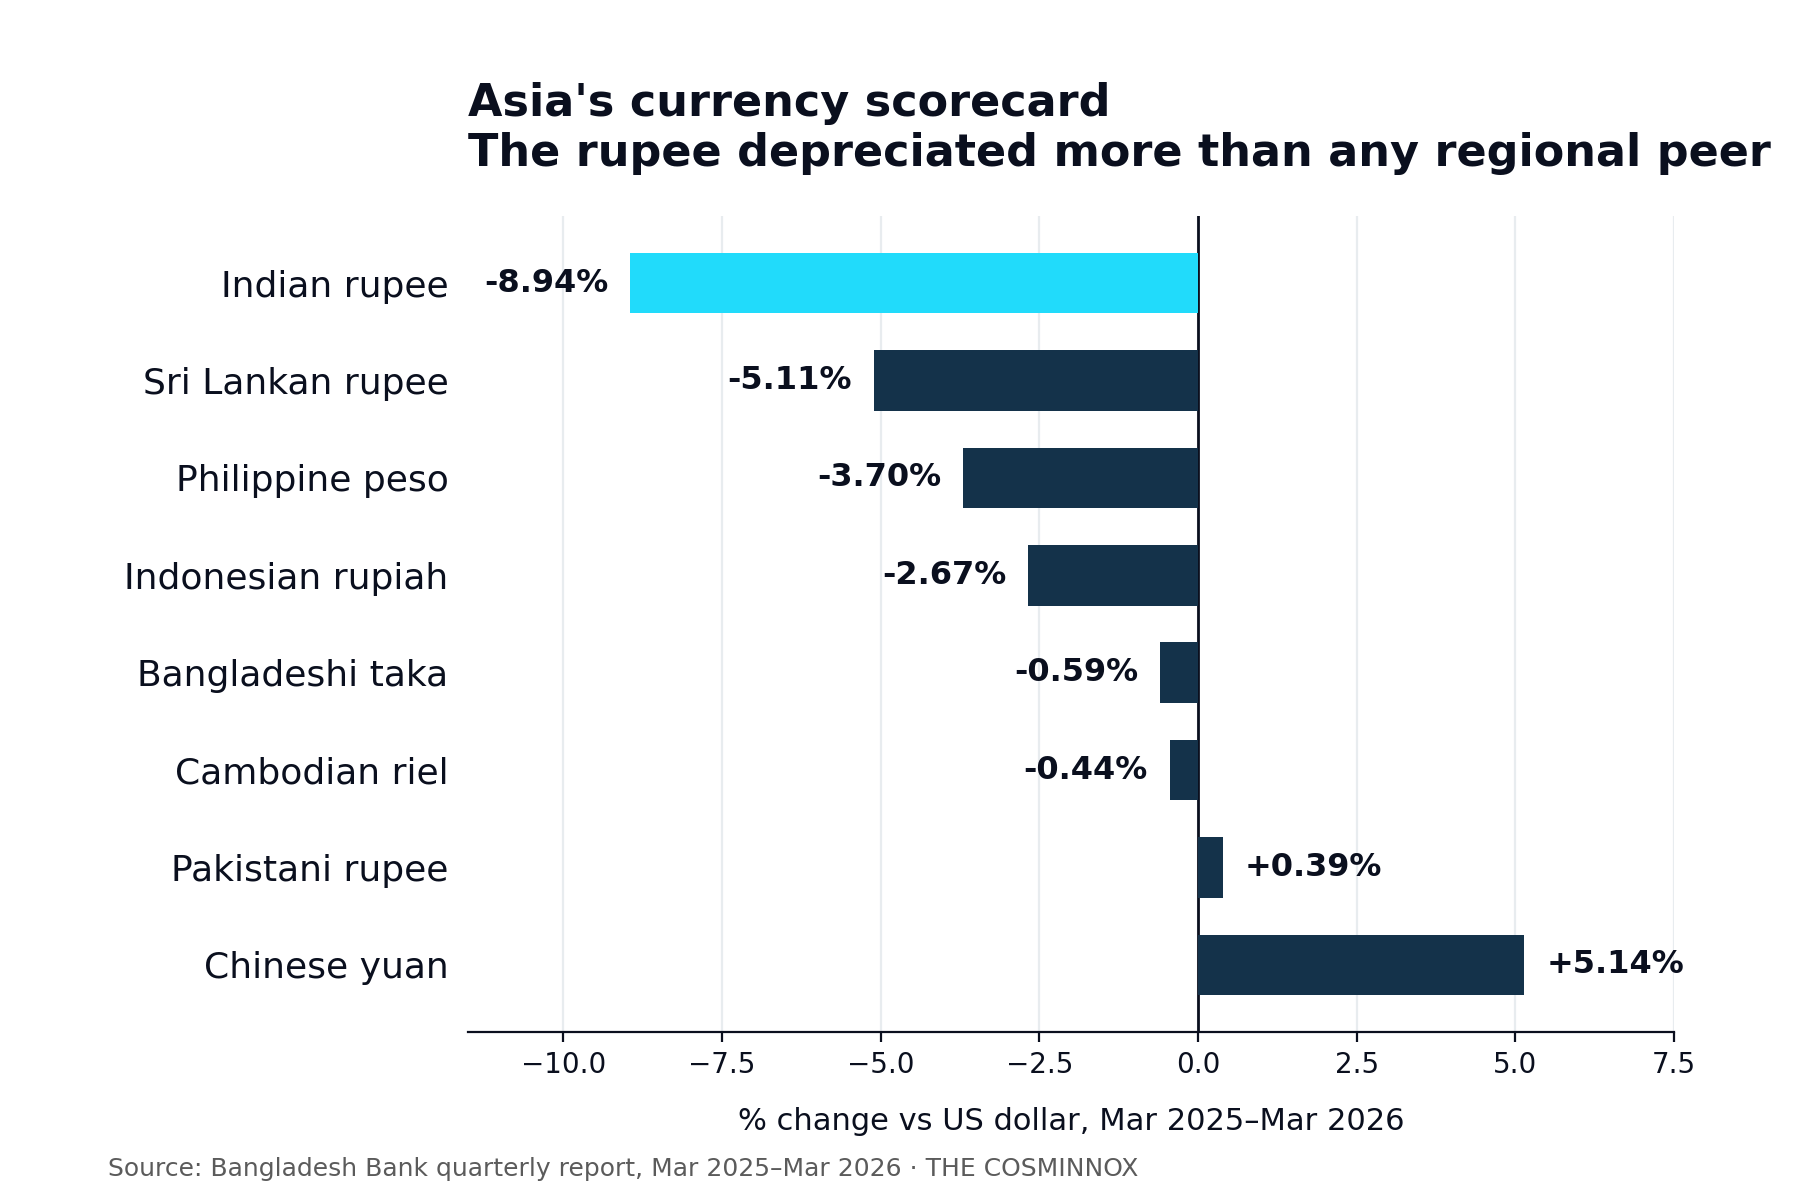
The comparison that gives this story its edge is regional, not global. Bangladesh Bank's own quarterly report, covering March 2025 to March 2026, found the Indian rupee had the sharpest depreciation in South Asia at 8.94 percent, ahead of the Sri Lankan rupee (5.11 percent), the Philippine peso (3.70 percent) and the Indonesian rupiah (2.67 percent) over the same window. The Pakistani rupee appreciated 0.39 percent and the Bangladeshi taka itself depreciated only 0.59 percent — behind only Cambodia's riel (down 0.44 percent) as the region's most stable currency — while the Chinese yuan appreciated 5.14 percent, the strongest performer in the comparison set. (Bangladesh Bank, cited in Views Bangladesh, August 2026)
That stability is not, in every case, evidence of stronger underlying fundamentals — it partly reflects different policy choices. The IMF's own May 2026 review of Pakistan's Extended Fund Facility found the rupee "broadly stable" at around PRs 280 per dollar, helped by State Bank of Pakistan dollar purchases that kept reserves above program targets at $16 billion at end-December 2025 — a currency held steady inside an active IMF stabilisation program rather than one moving freely under comparable external pressure. (IMF Country Report No. 26/101, May 2026) Indonesia's central bank, for its part, has been intervening directly in spot and forward markets to defend the rupiah, and its finance minister has cited a shallow domestic financial market reliant on volatile foreign portfolio flows as a structural vulnerability of its own. (WION, May 2026) The comparison, in other words, is not "India versus economies with no currency stress" — it is India versus economies managing similar stress through different instruments, some of which (capital controls, IMF-anchored reserve targets) are not tools India has chosen to use.
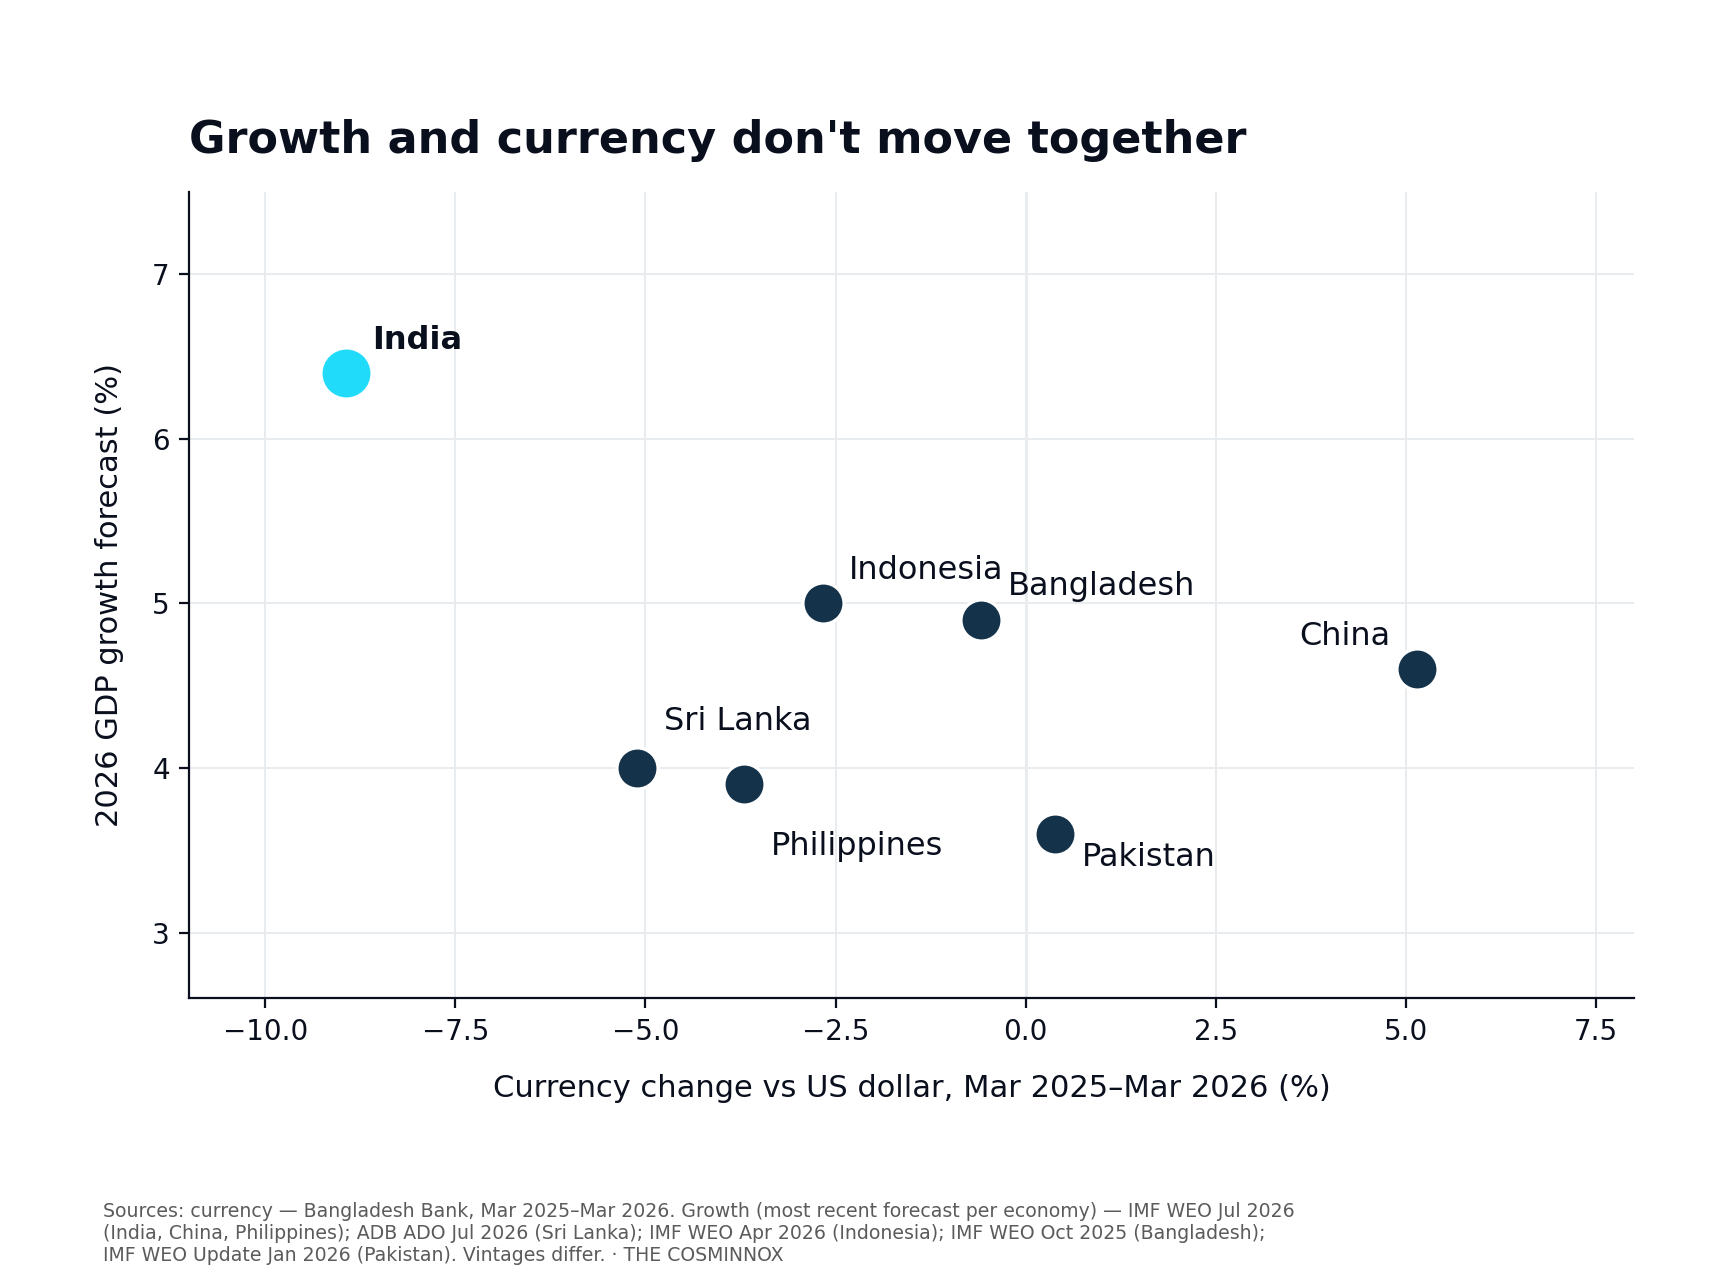
Layering growth forecasts onto the same currency comparison makes the disconnect sharper still. India sits alone in the upper-left of the region — the fastest-growing economy in the set and also the one whose currency depreciated most. No other economy compared combines a growth forecast above 5 percent with currency depreciation greater than 3 percent; most of India's peers cluster in the middle, trading off some growth for currency stability, or vice versa. The chart below draws on the same Bangladesh Bank currency window paired with each economy's most recently published growth forecast — the forecasts are not all from the same report date, which is flagged directly on the visual rather than smoothed over.
The Policy Response
The RBI's countermeasures, announced alongside its June 5, 2026 monetary policy decision, were deliberately structured around what the IMPRI review calls a Tinbergen-rule separation of instruments — using capital-account tools to address the currency while leaving the repo rate, held at 5.25 percent, to manage domestic inflation rather than defend the exchange rate directly. (IMPRI Impact and Policy Research Institute, August 2026) The package included seven measures:
removal of FPI concentration limits, individual security restrictions, and short-term investment caps on non-fully-accessible routes;
higher NRI/OCI/PROI equity investment ceilings, extended to all individual investors resident outside India;
a facility under which the RBI absorbs the full hedging cost on fresh three-to-five-year FCNR(B) deposits through September 30, expected to lift the effective NRI deposit rate by 150–200 basis points;
exemption of fresh three-to-five-year FCNR(B) deposits mobilised during the window from CRR and SLR requirements, allowing banks to deploy the full amount of these deposits;
exemption of FPI gains on government securities from tax, including capital gains and interest withholding taxes;
concessional FX swaps to encourage public-sector external commercial borrowing; and
restoration of the export proceeds realisation and repatriation period to nine months, from the earlier 15-month period. (Business Standard, June 2026; Outlook Business, June 2026)
The FCNR(B) route in particular has precedent: Raghuram Rajan used the same mechanism in September 2013 to draw in $26 billion during the taper-tantrum rupee crisis. MUFG Research's assessment of the 2026 version is more cautious about the likely scale, estimating roughly $20 billion this time, because the interest-rate spread that made the 2013 scheme attractive — high Indian yields against very low US short-end rates — has narrowed considerably, with five-year INR yields near 6.4 percent against US short rates near 4 percent. (MUFG Research, June 2026)
Assessments of the package's likely effect diverge. SBI Research projects that, combined with softer crude prices, the measures could swing India's FY27 overall balance of payments to a $5–10 billion surplus, against an earlier internal estimate of a $65–70 billion deficit. (NewKerala, citing SBI Research, June 2026) IMPRI's independent review reaches a narrower conclusion: the June 2026 measures address short-term financing pressure but "do not deal with the root cause of the problem" — a merchandise trade deficit that remains sensitive to oil prices regardless of how much foreign capital is drawn in through deposit and bond channels. (IMPRI Impact and Policy Research Institute, August 2026)
Counter-Evidence: What Argues Against a Crisis Reading
Set against the depreciation numbers is a set of facts that complicate any straightforward "India in crisis" reading.
First, reserves remain large by historical standards. The RBI's Annual Report 2025-26 put reserves at $691.1 billion as of end-March 2026, a level the central bank itself describes as "adequate against standard metrics," and a separate market commentary estimated reserves still covered roughly 11 months of imports even after several months of dollar sales to slow the rupee's fall. (Business Upturn, citing RBI Annual Report, May 2026; India Macro Indicators, June 2026)
Second, the current account deficit itself stayed contained. RBI data show the full-year FY26 CAD widened in dollar terms to $25.2 billion from $22.9 billion, but held steady at 0.6 percent of GDP — a ratio well below the roughly 4–5 percent of GDP deficit that characterised India's 2013 taper-tantrum episode, which is the natural historical comparison for "record-low rupee" headlines. (Forbes India, citing RBI data, June 2026)
Third, one market commentary — not an official RBI position, and presented here as an attributed view rather than fact — argues the 1997-crisis comparison that a record-low rupee invites does not hold structurally, since the 1997 Asian financial crisis broke currencies pegged with heavy short-term dollar debt (Thailand, Indonesia, South Korea), a balance-sheet structure India's largely market-determined, reserve-backed rupee does not share. (India Macro Indicators, June 2026)
Fourth, the growth and outflow numbers are not moving in lockstep — FPI flows briefly turned positive in early August 2026, with ₹12,921 crore entering Indian equities on what market participants attributed to expectations of US rate cuts, softer crude and a stabilising rupee, even as the full-year 2026 outflow figure remained deeply negative. (The Federal, August 2026)
What the Evidence Does and Doesn't Establish
The data supports a narrower claim than either headline version of this story — "India's currency crisis" or "nothing to see here." What it establishes is this: India's currency weakness in 2026 is real, regionally distinctive, and driven by an identifiable combination of an oil-price shock, a sharp and largely synchronized FPI equity exodus, and US tariff exposure — not by a collapse in growth, which by IMF and domestic data has if anything strengthened over the same period. It also establishes that India's neighbours are not facing an identical test; several (Pakistan, Bangladesh) are holding their currencies steadier through IMF-anchored reserve management or tighter capital-account controls, which is a different kind of stability than a freely adjusting, reserve-backed currency provides, not necessarily a stronger one.
What the evidence does not establish is which of the two forecasts on the table — SBI Research's projected swing to a small balance-of-payments surplus in FY27, or IMPRI's caution that the June 2026 measures leave the trade-deficit root cause unaddressed — will prove closer to right. Both are informed, both are attributed to named institutions, and both remain forecasts rather than settled outcomes as of this writing. Readers tracking this story should treat the next two data points — the Q1 FY27 current account release and the pace of FPI flows through September, when the RBI's FCNR(B) hedge-cost subsidy expires — as the actual test of which reading holds.
Figures in this piece are current as of the cited publication dates and August 10–11, 2026 for live market data; exchange rates and flow figures will move after publication. The COSMINNOX will publish a dated correction note here if any cited figure is revised.