
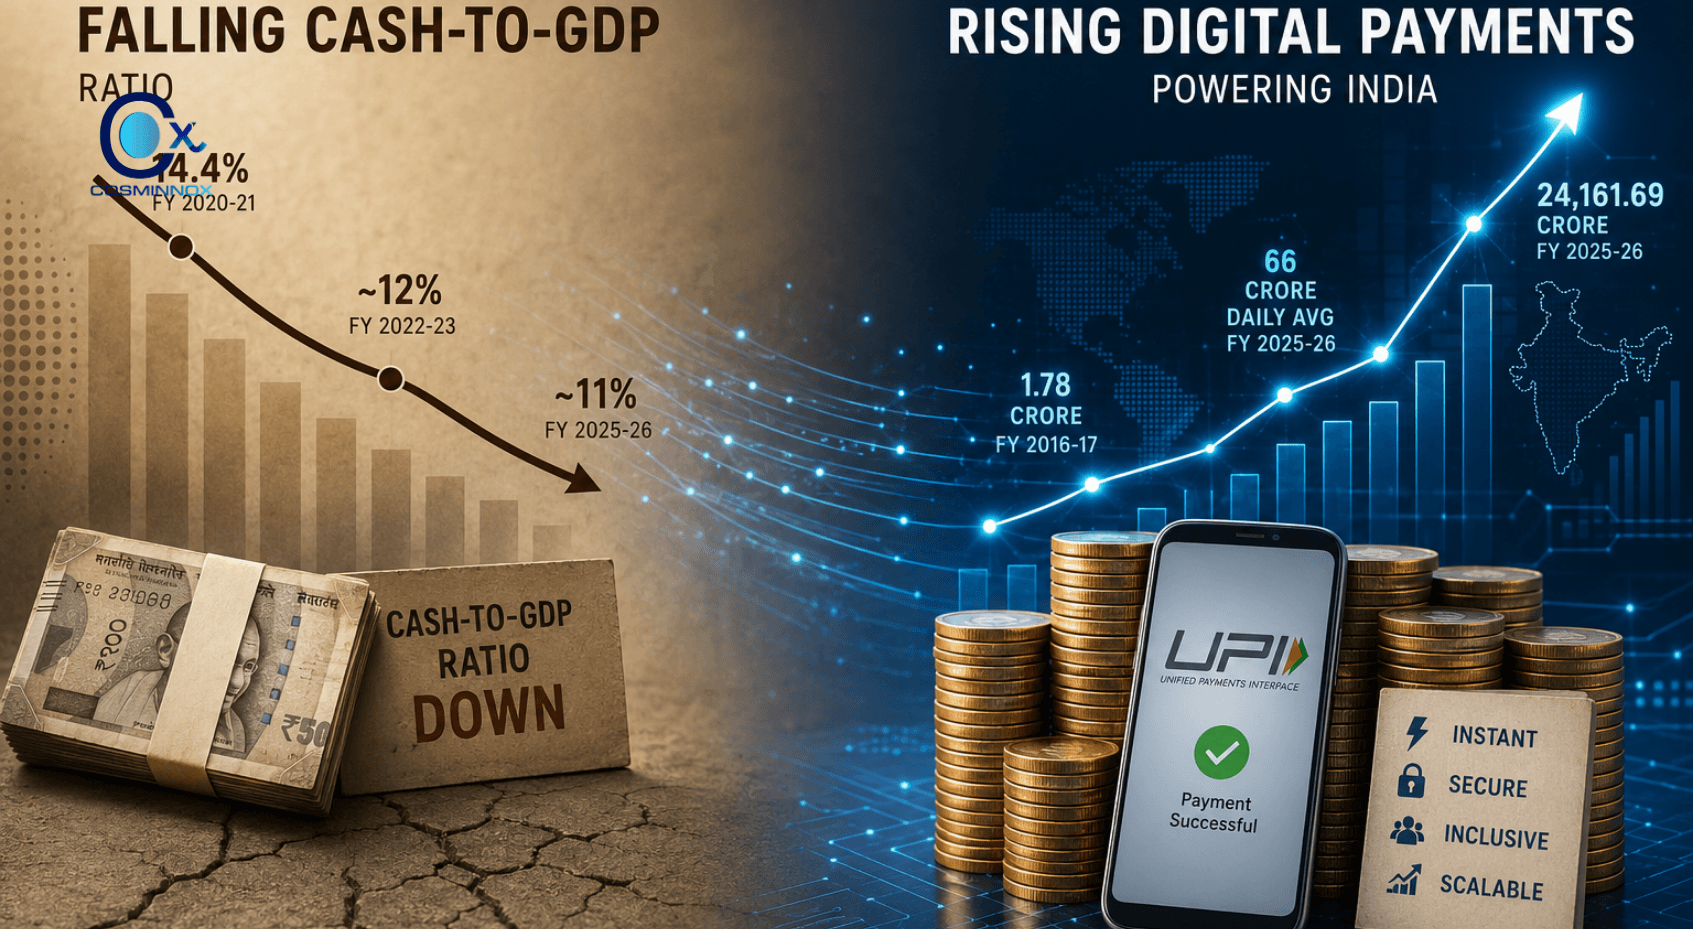
The decade in numbers
UPI went live on 11 April 2016, built by the National Payments Corporation of India (NPCI) under Reserve Bank of India oversight; its public rollout is more commonly dated to 25 August 2016, which the Finance Ministry marked as the platform's tenth anniversary this year [Ministry of Finance statement, PTI/Business Standard, 24 Aug 2026]. A separate PIB release timed to April 2026 anchors the same decade to the April launch date and puts the volume increase at “almost 12,000-fold” rather than 13,000-fold [PIB, Ministry of Finance, 30 Apr 2026] — a gap that reflects rounding and reference-date choices rather than a substantive dispute over the underlying trend.
Metric | FY 2016-17 | FY 2025-26 | Change |
Annual transaction volume | 1.78 crore | 24,161.69 crore | ~13,000-fold |
Annual transaction value | ₹0.07 lakh crore | ~₹314 lakh crore | ~4,000-fold |
Banks live on UPI | 44 (21 at launch) | 703 | 16x |
Daily average transactions | — | 66 crore | — |
YoY volume / value growth (FY26) | — | 30.0% / 20.6% | — |
[Ministry of Finance/PIB, 30 Apr 2026 and 24 Aug 2026; as of FY2025-26]
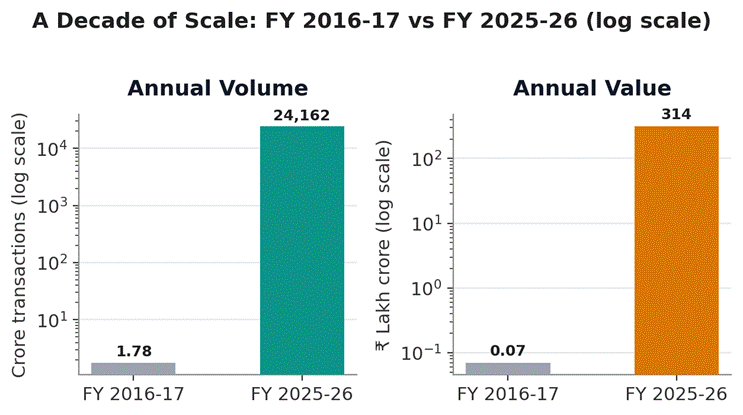
Fig. 1 — Annual UPI volume and value, FY2016-17 vs FY2025-26 (log scale). Source: Ministry of Finance/PIB, 30 Apr 2026 & 24 Aug 2026.
Momentum has not plateaued
UPI's second decade opened with successive monthly records rather than a slowdown: volumes crossed 2,000 crore for the first time in August 2025, then kept climbing.
Month | Transactions | Value |
Aug 2025 | 2,001 crore | — |
Dec 2025 | 2,163 crore | — |
Mar 2026 | 2,264 crore | ₹29.53 lakh crore |
May 2026 | 2,320 crore | — |
Jul 2026 | 2,366 crore (record) | ₹29.88 lakh crore (record) |
[PIB, 30 Apr 2026; Organiser/government data, 25 Aug 2026]; bank count of 741 reported by July 2026
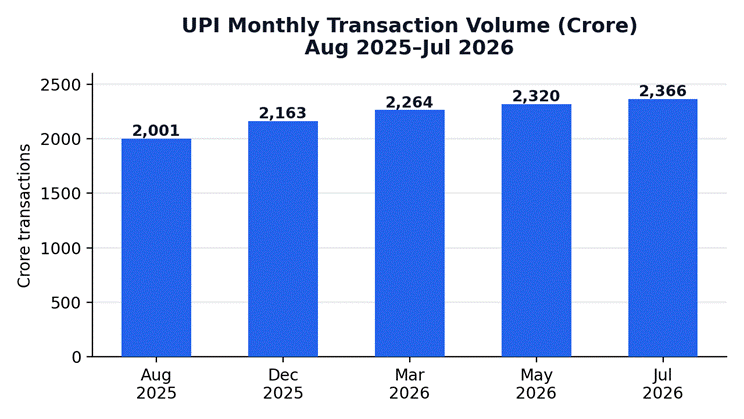
Fig. 2 — UPI monthly transaction volume, Aug 2025–Jul 2026. Source: PIB, 30 Apr 2026; Organiser, 25 Aug 2026.
By FY2025-26, UPI accounted for roughly 85% of India's digital payment transactions and close to 49% of global real-time payment volume, a scale the IMF has separately described as the world's largest real-time payment system [PIB, 30 Apr 2026]. Person-to-merchant (P2M) transactions make up 63% of total volume, while person-to-person (P2P) transfers account for 71% of total value — 86% of P2M payments and 59% of P2P payments are below ₹500, indicating the system's core use case remains small, frequent, everyday payments rather than large transfers [PIB, 30 Apr 2026]. UPI is now live in eight countries per the April 2026 government release, with later reporting citing expansion to Cambodia, Greece and the Maldives by August [PIB, 30 Apr 2026; Organiser, 25 Aug 2026].
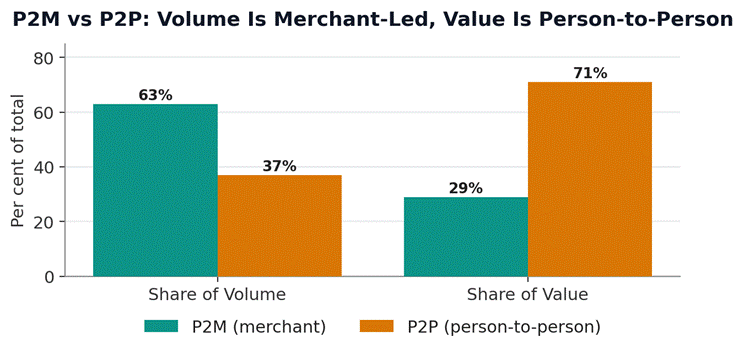
Fig. 3 — P2M dominates volume, P2P dominates value, FY2025-26. Source: PIB, 30 Apr 2026.
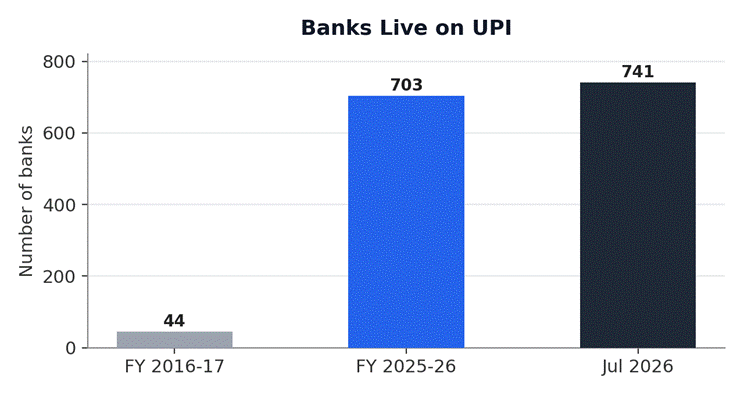
Fig. 4 — Banks live on UPI, FY2016-17 to Jul 2026. Source: PIB, 30 Apr 2026; Organiser, 25 Aug 2026.
The original aim, and how far it has landed
UPI was not conceived as a stand-alone product; it operationalised a policy goal the RBI had already set out. The RBI's five-yearly Payment and Settlement Systems Vision documents, starting with Vision 2012-15, committed the central bank “to encourage greater use of electronic payments by all sections of society so as to achieve a ‘less-cash’ society,” an objective Vision-2018 explicitly reiterated as UPI was being rolled out [RBI, Payment and Settlement Systems in India: Vision-2018]. NPCI itself was set up in 2008 “to create a robust and secure infrastructure for payment and settlement systems in the country, to promote a cashless economy and enhance financial inclusion” — the second half of that mandate, financial inclusion, is the other stated aim against which UPI's decade can be measured.
Aim 1 — a “less-cash” society: partially met, and openly contested by the RBI's own data. The cash-to-GDP ratio has fallen from 14.4% in FY2020-21 to roughly 11% in FY2025-26, indicating digital payments are absorbing a growing share of transaction value relative to the size of the economy [Asian Mirror, citing RBI data, Aug 2026]. Yet currency in circulation (CIC) has kept rising in absolute terms, reaching a record ₹42.76 lakh crore by end-July 2026, up 12.5% year-on-year, even as UPI volumes grew roughly 21–30% over the same stretch [RBI Annual Report 2025-26, via The Federal, Aug 2026]. RBI Deputy Governor S C Murmu, speaking at a Bank Indonesia seminar in Jakarta on 13 August 2026, called this coexistence of soaring digital payments and record cash a “paradox” that makes future currency demand difficult for the RBI to model or plan around [PTI via The Federal, 18 Aug 2026]. RBI's own research attributes part of the rise to precautionary, store-of-value cash holding in high-denomination notes rather than transactional use — a pattern distinct from the “less-cash” transactional goal the Vision documents targeted [Business Standard, citing RBI, 1 Jun 2023 and updated 2 Jun 2026].
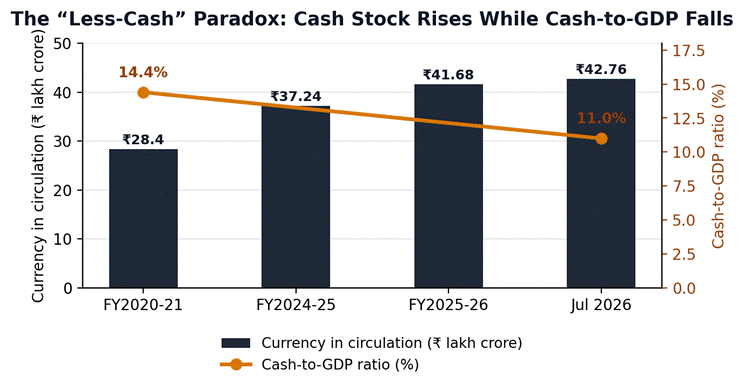
Fig. 5 — Currency in circulation keeps rising even as cash-to-GDP falls. Source: RBI Annual Report 2025-26 via Business Standard/The Federal, Apr–Aug 2026; Asian Mirror, Aug 2026.
Aim 2 — financial inclusion: on track by the index-level metrics available. The RBI's composite Financial Inclusion Index, which weights Access, Usage and Quality, has risen steadily since it was first published — from 43.4 in March 2017 to 53.9 in March 2021, and on to 67 in March 2025 and 70 in FY2025-26 — with the Usage sub-index, the one UPI activity feeds most directly, contributing the largest share of the recent improvement [RBI Financial Inclusion Index releases, RBI/Business Standard/Edunovations, 2021–2026]. Pradhan Mantri Jan Dhan Yojana, the account base UPI transacts on top of, had opened more than 560 million accounts by August 2025, of which about 66.75% are in rural or semi-urban India and 55.7% are held by women [Business Standard, 28 Aug 2025]. A caveat worth recording: peer-reviewed research is more circumspect about depth of inclusion than the index-level numbers suggest — a 2026 rural case study found UPI adoption is not uniform across income, caste and gender lines even where bank accounts exist, and cautioned against equating account access with full financial inclusion [Journal of Economic Asymmetries, 2026, Elsevier/ScienceDirect].
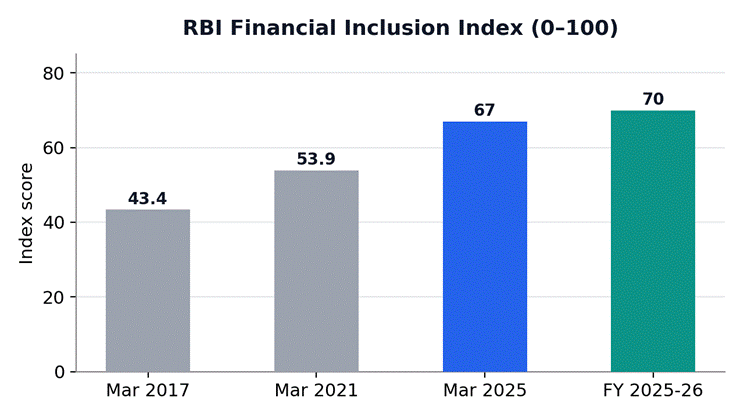
Fig. 6 — RBI Financial Inclusion Index, March 2017–FY2025-26. Source: RBI press releases via Business Standard, 2021–2023; Edunovations, Jul 2026.
Counter-evidence: concentration at the app layer
The infrastructure is interoperable by design, but usage is not evenly spread. PhonePe and Google Pay together processed over 80% of UPI transaction volume as of April 2026, with PhonePe alone at roughly 47% [NPCI data via StartupFeed, 28 May 2026]; Reuters reported the same duopoly pattern through 2024-25 [Reuters, 31 Dec 2024]. NPCI's own 30% market-share cap on individual third-party apps, first proposed in 2020 for enforcement by 2021, has now been deferred twice, most recently to 31 December 2026: “considering various factors, the timeline for compliance of existing TPAPs who are exceeding the volume cap is extended by two years,” NPCI said in the circular announcing the second postponement [NPCI circular via Inc42, 2 Jun 2025]. Separately, UPI has carried zero Merchant Discount Rate since January 2020, a policy credited with accelerating merchant adoption but one that continues to raise questions among smaller payment service providers about commercial sustainability, a point noted in government-briefing summaries without an official resolution on record [PIB summary via Legacy IAS, 25 Aug 2026].
What the evidence establishes — and what it doesn't
The volume and value data support a bounded claim: UPI has scaled from a negligible share of India's payments to its dominant rail, across users, merchants and now eleven-odd partner countries, without requiring uniform hardware or a single dominant app. Measured against the RBI's own stated aims, the record is mixed rather than uniform: financial inclusion, tracked through the RBI's own index and PMJDY's account base, shows sustained, measurable progress; the “less-cash society” goal is only partly borne out, since cash's share of GDP has fallen even as the absolute stock of currency in circulation keeps setting records — a tension the RBI itself says it cannot yet fully explain. What the data does not establish is that UPI's scale has translated into a competitive app-layer market — the 30% concentration cap remains unenforced six years after it was first proposed — or that zero-MDR economics are sustainable for every participant in the ecosystem. These questions sit outside the scope of the anniversary numbers themselves and merit separate scrutiny as UPI enters its second decade.
Figures are as of August 2026 and may be revised in subsequent NPCI/RBI releases; any correction will be noted here with a dated update rather than a silent edit.